The regression model estimates that _____ fraction of the variation in the price of the residential properties is explained by the size of the properties
The regression model estimates that _____ fraction of the variation in the price of the residential properties is explained by the size of the properties

College Algebra
7th Edition
ISBN:9781305115545
Author:James Stewart, Lothar Redlin, Saleem Watson
Publisher:James Stewart, Lothar Redlin, Saleem Watson
Chapter1: Equations And Graphs
Section: Chapter Questions
Problem 10T: Olympic Pole Vault The graph in Figure 7 indicates that in recent years the winning Olympic men’s...

Related questions
Question
| 29 | The regression model estimates that _____ fraction of the variation in the price of the residential properties is explained by the size of the properties. | |||||||||
| a | 0.1571 | |||||||||
| b | 0.1745 | |||||||||
| c | 0.1939 | |||||||||
| d | 0.2155 |
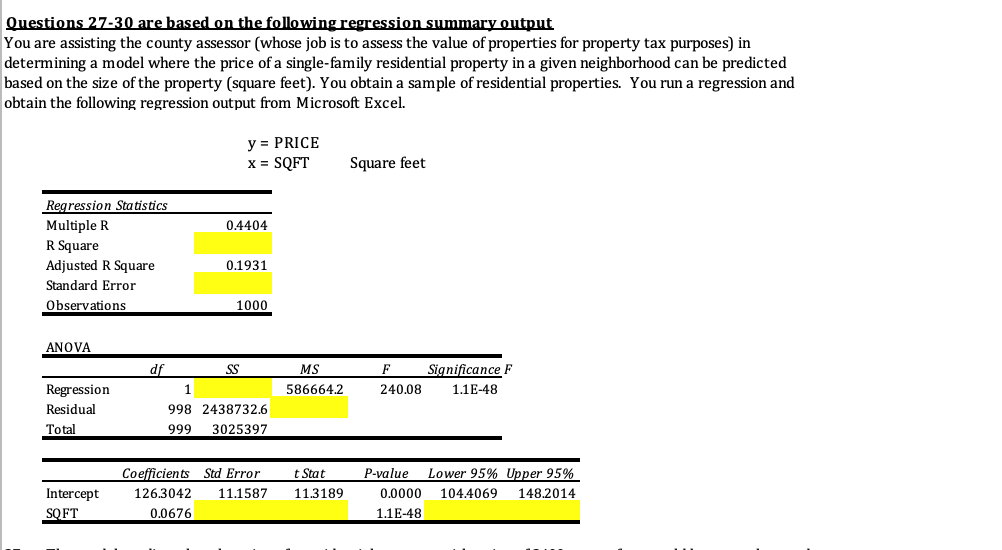
Transcribed Image Text:Questions 27-30 are basedon the following regression summary output
You are assisting the county assessor (whose job is to assess the value of properties for property tax purposes) in
determining a model where the price of a single-family residential property in a given neighborhood can be predicted
based on the size of the property (square feet). You obtain a sample of residential properties. You run a regression and
obtain the following regression output from Microsoft Excel.
y = PRICE
x = SQFT
Square feet
Regression Statistics
Multiple R
0.4404
R Square
Adjusted R Square
0.1931
Standard Error
Observations
1000
ANOVA
df
SS
MS
F
Significance F
Regression
1.
586664.2
240.08
1.1E-48
Residual
998 2438732.6
Total
999
3025397
Coefficients
Std Error
t Stat
P-value
Lower 95% Upper 95%
Intercept
126.3042
11.1587
11.3189
0.0000
104.4069
148.2014
SOFT
0.0676
1.1E-48
Expert Solution
This question has been solved!
Explore an expertly crafted, step-by-step solution for a thorough understanding of key concepts.

Step by step
Solved in 2 steps

Recommended textbooks for you
College Algebra
Algebra
ISBN:
9781305115545
Author:
James Stewart, Lothar Redlin, Saleem Watson
Publisher:
Cengage Learning

Functions and Change: A Modeling Approach to Coll…
Algebra
ISBN:
9781337111348
Author:
Bruce Crauder, Benny Evans, Alan Noell
Publisher:
Cengage Learning

Algebra and Trigonometry (MindTap Course List)
Algebra
ISBN:
9781305071742
Author:
James Stewart, Lothar Redlin, Saleem Watson
Publisher:
Cengage Learning
College Algebra
Algebra
ISBN:
9781305115545
Author:
James Stewart, Lothar Redlin, Saleem Watson
Publisher:
Cengage Learning
Functions and Change: A Modeling Approach to Coll…
Algebra
ISBN:
9781337111348
Author:
Bruce Crauder, Benny Evans, Alan Noell
Publisher:
Cengage Learning
Algebra and Trigonometry (MindTap Course List)
Algebra
ISBN:
9781305071742
Author:
James Stewart, Lothar Redlin, Saleem Watson
Publisher:
Cengage Learning

Algebra & Trigonometry with Analytic Geometry
Algebra
ISBN:
9781133382119
Author:
Swokowski
Publisher:
Cengage