The regression results, and summary statistics, below relate price of apples with the supply of apples (measured in cents per apple) by different farmers across the US. So the higher the market price, the more they are willing to sell. Regression Statistics price 14.8482 Multiple R 0.61448 Sample Mean R Square 0.37758 Sample Variance 26.5917 Adjusted R Square 0.37123 Standard Error 2.03014 Observations 100 ANOVA df MS Regression 245.021 245.0211668 59.4501 Residual 403.903 4.121458733 Total 648.924 Coefficientsandard Err t Stat P-value Intercept 3.8314 0.62159 6.163885682 1.6E-08 price 0.30508 0.03957 You are a juice seller and want to get apples at a good price for producing your juice. Then you go to a zone where there are many apple farms and you have been informed that apple prices are about 9 cents per apple in the zone. If you calculate a 95% prediction interval of the number of apples a farmer will be willing to sell with the price you are informed in that zone (it is allowed to buy fractions of apples), what of the following is the upper bound of the interval. to.01,98= 2.365002, to.026,00=1.984467, to.os,08=1.660551, to.1,98=1.29026 Select one: a. 10.6719 b. 10.6619 C. 10.6519 d. 10.6819 e. 10.6419
The regression results, and summary statistics, below relate price of apples with the supply of apples (measured in cents per apple) by different farmers across the US. So the higher the market price, the more they are willing to sell. Regression Statistics price 14.8482 Multiple R 0.61448 Sample Mean R Square 0.37758 Sample Variance 26.5917 Adjusted R Square 0.37123 Standard Error 2.03014 Observations 100 ANOVA df MS Regression 245.021 245.0211668 59.4501 Residual 403.903 4.121458733 Total 648.924 Coefficientsandard Err t Stat P-value Intercept 3.8314 0.62159 6.163885682 1.6E-08 price 0.30508 0.03957 You are a juice seller and want to get apples at a good price for producing your juice. Then you go to a zone where there are many apple farms and you have been informed that apple prices are about 9 cents per apple in the zone. If you calculate a 95% prediction interval of the number of apples a farmer will be willing to sell with the price you are informed in that zone (it is allowed to buy fractions of apples), what of the following is the upper bound of the interval. to.01,98= 2.365002, to.026,00=1.984467, to.os,08=1.660551, to.1,98=1.29026 Select one: a. 10.6719 b. 10.6619 C. 10.6519 d. 10.6819 e. 10.6419

Big Ideas Math A Bridge To Success Algebra 1: Student Edition 2015
1st Edition
ISBN:9781680331141
Author:HOUGHTON MIFFLIN HARCOURT
Publisher:HOUGHTON MIFFLIN HARCOURT
Chapter11: Data Analysis And Displays
Section11.3: Shapes Of Distributions
Problem 20E

Related questions
Topic Video
Question
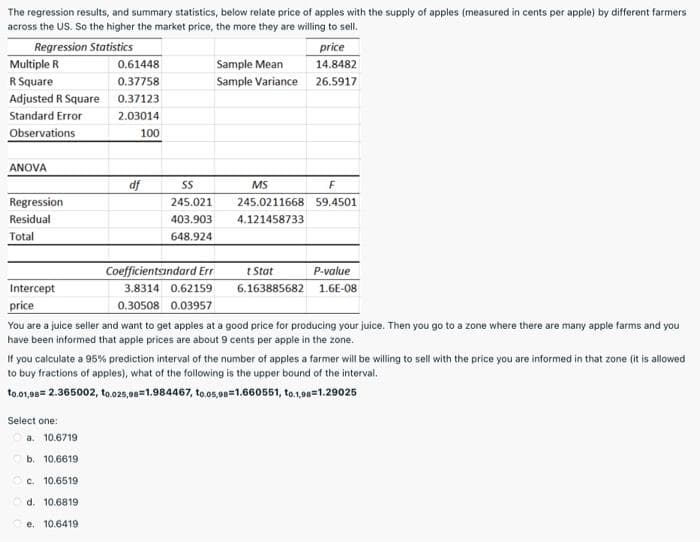
Transcribed Image Text:The regression results, and summary statistics, below relate price of apples with the supply of apples (measured in cents per apple) by different farmers
across the US. So the higher the market price, the more they are willing to sell.
Regression Statistics
Multiple R
price
14.8482
0.61448
Sample Mean
R Square
0.37758
Sample Variance 26.5917
Adjusted R Square
0.37123
Standard Error
2.03014
Observations
100
ANOVA
df
MS
Regression
245.021
245.0211668 59.4501
Residual
403.903
4.121458733
Total
648.924
Coefficientsandard Err
t Stat
P-value
Intercept
3.8314 0.62159
6.163885682 1.6E-08
price
0.30508 0.03957
You are a juice seller and want to get apples at a good price for producing your juice. Then you go to a zone where there are many apple farms and you
have been informed that apple prices are about 9 cents per apple in the zone.
If you calculate a 95% prediction interval of the number of apples a farmer will be willing to sell with the price you are informed in that zone (it is allowed
to buy fractions of apples), what of the following is the upper bound of the interval.
to.01,98= 2.365002, to.025,98=1.984467, to.05,98=1.660551, to.1,98=1.29025
Select one:
a. 10.6719
b. 10.6619
c. 10.6519
d. 10.6819
e. 10.6419
Expert Solution
This question has been solved!
Explore an expertly crafted, step-by-step solution for a thorough understanding of key concepts.

This is a popular solution!

Trending now
This is a popular solution!

Step by step
Solved in 2 steps

Knowledge Booster


Learn more about
Need a deep-dive on the concept behind this application? Look no further. Learn more about this topic, statistics and related others by exploring similar questions and additional content below.Recommended textbooks for you
Big Ideas Math A Bridge To Success Algebra 1: Stu…
Algebra
ISBN:
9781680331141
Author:
HOUGHTON MIFFLIN HARCOURT
Publisher:
Houghton Mifflin Harcourt

Glencoe Algebra 1, Student Edition, 9780079039897…
Algebra
ISBN:
9780079039897
Author:
Carter
Publisher:
McGraw Hill
Big Ideas Math A Bridge To Success Algebra 1: Stu…
Algebra
ISBN:
9781680331141
Author:
HOUGHTON MIFFLIN HARCOURT
Publisher:
Houghton Mifflin Harcourt
Glencoe Algebra 1, Student Edition, 9780079039897…
Algebra
ISBN:
9780079039897
Author:
Carter
Publisher:
McGraw Hill