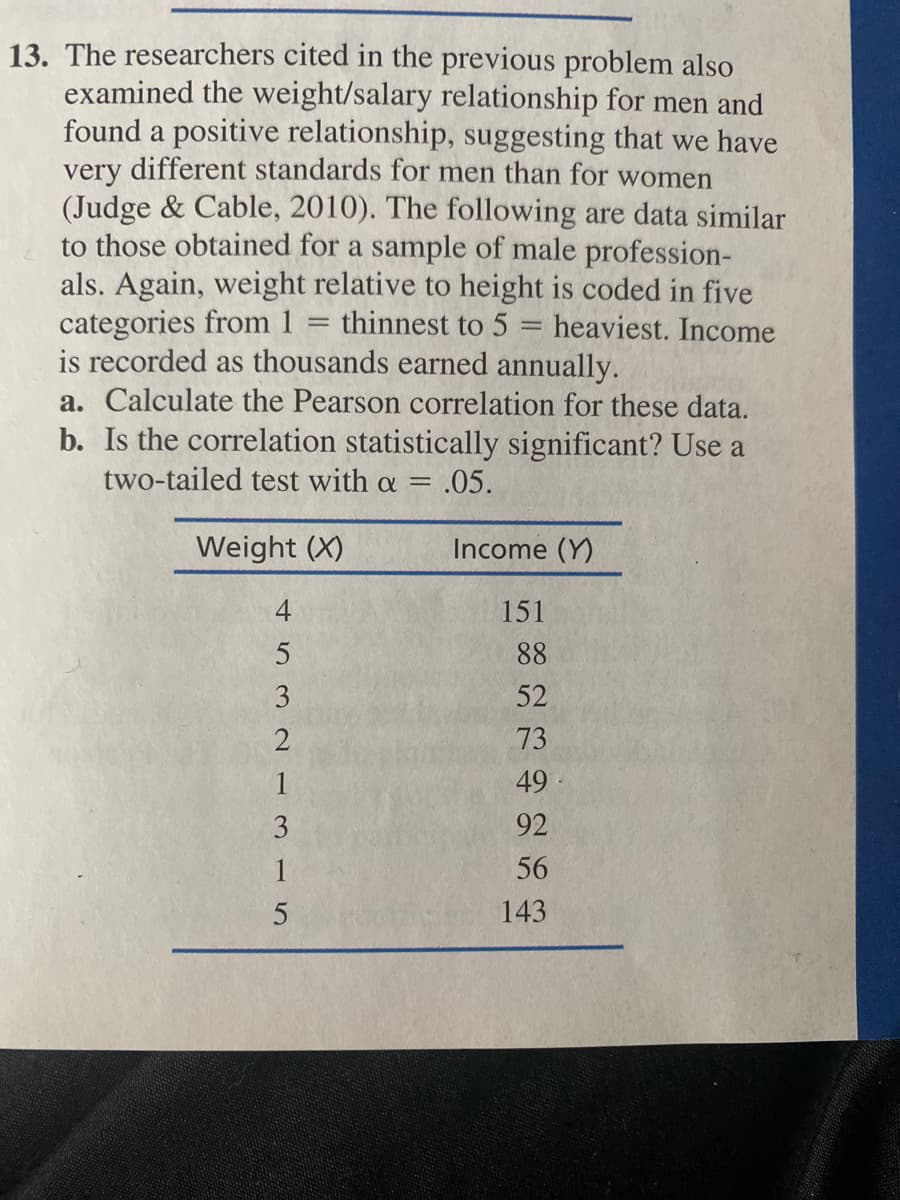
The researchers cited in the previous problem also examined the weight/salary relationship for men and found a positive relationship, suggesting that we have very different standards for men than for women (Judge & Cable, 2010). The following are data similar to those obtained for a sample of male profession- als. Again, weight relative to height is coded in five categories from 1 = thinnest to 5 = heaviest. Income is recorded as thousands earned annually. a. Calculate the Pearson correlation for these data. b. Is the correlation statistically significant? Use a two-tailed test with a = = .05. Weight (X) Income (Y) 4 151 88 3 52 73 1 49 3 92 1 56 143
The researchers cited in the previous problem also examined the weight/salary relationship for men and found a positive relationship, suggesting that we have very different standards for men than for women (Judge & Cable, 2010). The following are data similar to those obtained for a sample of male profession- als. Again, weight relative to height is coded in five categories from 1 = thinnest to 5 = heaviest. Income is recorded as thousands earned annually. a. Calculate the Pearson correlation for these data. b. Is the correlation statistically significant? Use a two-tailed test with a = = .05. Weight (X) Income (Y) 4 151 88 3 52 73 1 49 3 92 1 56 143

Glencoe Algebra 1, Student Edition, 9780079039897, 0079039898, 2018
18th Edition
ISBN:9780079039897
Author:Carter
Publisher:Carter
Chapter4: Equations Of Linear Functions
Section4.5: Correlation And Causation
Problem 11PPS

Related questions
Topic Video
Question
Transcribed Image Text:13. The researchers cited in the previous problem also
examined the weight/salary relationship for men and
found a positive relationship, suggesting that we have
very different standards for men than for women
(Judge & Cable, 2010). The following are data similar
to those obtained for a sample of male profession-
als. Again, weight relative to height is coded in five
categories from 1
is recorded as thousands earned annually.
a. Calculate the Pearson correlation for these data.
b. Is the correlation statistically significant? Use a
thinnest to 5 = heaviest. Income
two-tailed test with a = .05.
Weight (X)
Income (Y)
4
151
5
88
3.
52
73
1
49 ·
3
92
1
56
143
Expert Solution
This question has been solved!
Explore an expertly crafted, step-by-step solution for a thorough understanding of key concepts.

This is a popular solution!

Trending now
This is a popular solution!

Step by step
Solved in 3 steps with 2 images

Knowledge Booster


Learn more about
Need a deep-dive on the concept behind this application? Look no further. Learn more about this topic, statistics and related others by exploring similar questions and additional content below.Recommended textbooks for you
Glencoe Algebra 1, Student Edition, 9780079039897…
Algebra
ISBN:
9780079039897
Author:
Carter
Publisher:
McGraw Hill

Big Ideas Math A Bridge To Success Algebra 1: Stu…
Algebra
ISBN:
9781680331141
Author:
HOUGHTON MIFFLIN HARCOURT
Publisher:
Houghton Mifflin Harcourt
Glencoe Algebra 1, Student Edition, 9780079039897…
Algebra
ISBN:
9780079039897
Author:
Carter
Publisher:
McGraw Hill
Big Ideas Math A Bridge To Success Algebra 1: Stu…
Algebra
ISBN:
9781680331141
Author:
HOUGHTON MIFFLIN HARCOURT
Publisher:
Houghton Mifflin Harcourt