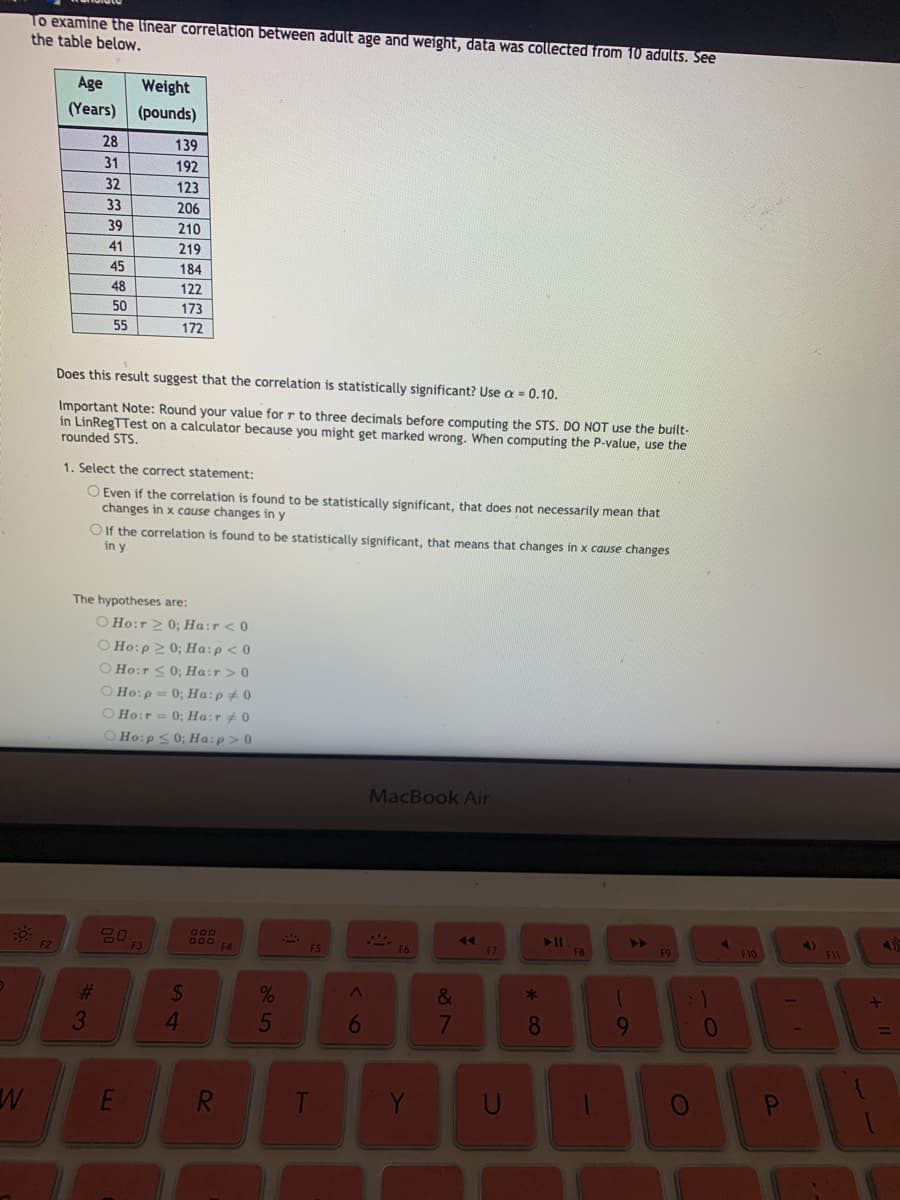
To examine the linear correlation between adult age and weight, data was collected from 10 adults. See the table below. Age Weight (Years) (pounds) 28 139 31 192 32 123 33 206 39 210 41 219 45 184 48 122 50 173 55 172 Does this result suggest that the correlation is statistically significant? Use a = 0.10. Important Note: Round your value for r to three decimals before computing the STS. DO NOT use the built- in LinRegTTest on a calculator because you might get marked wrong. When computing the P-value, use the rounded STS. 1. Select the correct statement: O Even if the correlation is found to be statistically significant, that does not necessarily mean that changes in x cause changes in y Olf the correlation is found to be statistically significant, that means that changes in x cause changes in y The hypotheses are: O Ho:r 2 0; Ha:r < 0 O Ho:p 2 0; Ha:p<0 Ho:r <0; Ha:r>0 O Ho:p = 0; Ha:p# 0 Ho:r = 0; Ha:r #0 O Ho:p S0; Ha:p> 0 %3D


Correlation
Correlation defines a relationship between two independent variables. It tells the degree to which variables move in relation to each other. When two sets of data are related to each other, there is a correlation between them.
Linear Correlation
A correlation is used to determine the relationships between numerical and categorical variables. In other words, it is an indicator of how things are connected to one another. The correlation analysis is the study of how variables are related.
Regression Analysis
Regression analysis is a statistical method in which it estimates the relationship between a dependent variable and one or more independent variable. In simple terms dependent variable is called as outcome variable and independent variable is called as predictors. Regression analysis is one of the methods to find the trends in data. The independent variable used in Regression analysis is named Predictor variable. It offers data of an associated dependent variable regarding a particular outcome.

Step by step
Solved in 2 steps


