The results of the sieve analysis done on a soil are shown below. Sieve No. Diameter Soil A 4 4.760 89 6 2.380 70 10 2.000 63 20 0.840 55 40 0.420 40 60 0.250 31 100 0.149 20 200 0.074 4 LL 60 PL 40 Determine its classification using USCS. SW
The results of the sieve analysis done on a soil are shown below. Sieve No. Diameter Soil A 4 4.760 89 6 2.380 70 10 2.000 63 20 0.840 55 40 0.420 40 60 0.250 31 100 0.149 20 200 0.074 4 LL 60 PL 40 Determine its classification using USCS. SW

Solid Waste Engineering
3rd Edition
ISBN:9781305635203
Author:Worrell, William A.
Publisher:Worrell, William A.
Chapter5: Separation Processes
Section: Chapter Questions
Problem 5.32P

Related questions

Question
The results of the sieve analysis done on a soil are shown below.
| Sieve No. | Diameter | Soil A |
| 4 | 4.760 | 89 |
| 6 | 2.380 | 70 |
| 10 | 2.000 | 63 |
| 20 | 0.840 | 55 |
| 40 | 0.420 | 40 |
| 60 | 0.250 | 31 |
| 100 | 0.149 | 20 |
| 200 | 0.074 | 4 |
| LL | 60 | |
| PL | 40 |
Determine its classification using USCS.
|
SW |
||
|
None of the above |
||
|
GW |
||
|
SP |
||
|
GP |
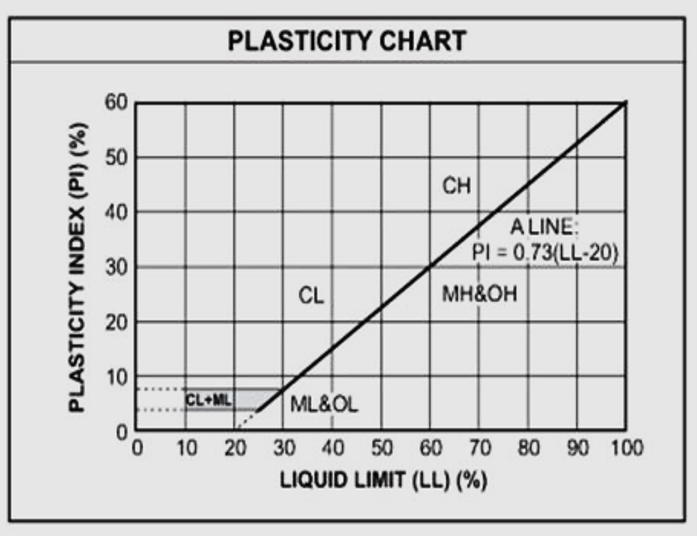
Transcribed Image Text:PLASTICITY CHART
60
50
CH
40
A LINE:
PI = 0,73(LL-20)
30
CL
MH&OH
20
CL+ML
ML&OL
10
20
30 40 50 60 70
80 90 100
LIQUID LIMIT (LL) (%)
PLASTICITY INDEX (PI) (%)
10
Expert Solution
This question has been solved!
Explore an expertly crafted, step-by-step solution for a thorough understanding of key concepts.

Step by step
Solved in 4 steps with 1 images

Knowledge Booster


Learn more about
Need a deep-dive on the concept behind this application? Look no further. Learn more about this topic, civil-engineering and related others by exploring similar questions and additional content below.Recommended textbooks for you
Solid Waste Engineering
Civil Engineering
ISBN:
9781305635203
Author:
Worrell, William A.
Publisher:
Cengage Learning,
Solid Waste Engineering
Civil Engineering
ISBN:
9781305635203
Author:
Worrell, William A.
Publisher:
Cengage Learning,