The scatter plot shows the theater revenue and rental revenue for each of 25 movies. Also shown is the line of best fit for Español the data. Fill in the blanks below. SAL Rental revenue X (in millions) of dollars X ^x xx 10 20 30 40 NI 280 100 110 Theater revenue (in millions of dollars) (a) For these 25 movies, as theater revenue increases, rental revenue tends to (Choose one) ▼ (b) for these 25 movies, there is (Choose one) correlation between theater revenue and rental revenue. (c) Using the line of best fit, we would predict that a movie generating a theater revenue of 50 million dollars would generate a rental revenue of approximately (Choose one) I Don't Know Submit 24- 11- 204 184 14. 14. 10 1 6 X x X x X X X X X x Start over
The scatter plot shows the theater revenue and rental revenue for each of 25 movies. Also shown is the line of best fit for Español the data. Fill in the blanks below. SAL Rental revenue X (in millions) of dollars X ^x xx 10 20 30 40 NI 280 100 110 Theater revenue (in millions of dollars) (a) For these 25 movies, as theater revenue increases, rental revenue tends to (Choose one) ▼ (b) for these 25 movies, there is (Choose one) correlation between theater revenue and rental revenue. (c) Using the line of best fit, we would predict that a movie generating a theater revenue of 50 million dollars would generate a rental revenue of approximately (Choose one) I Don't Know Submit 24- 11- 204 184 14. 14. 10 1 6 X x X x X X X X X x Start over

Glencoe Algebra 1, Student Edition, 9780079039897, 0079039898, 2018
18th Edition
ISBN:9780079039897
Author:Carter
Publisher:Carter
Chapter4: Equations Of Linear Functions
Section4.5: Correlation And Causation
Problem 11PPS

Related questions
Question
Transcribed Image Text:III
Knowledge Check
RAELIN V
Español
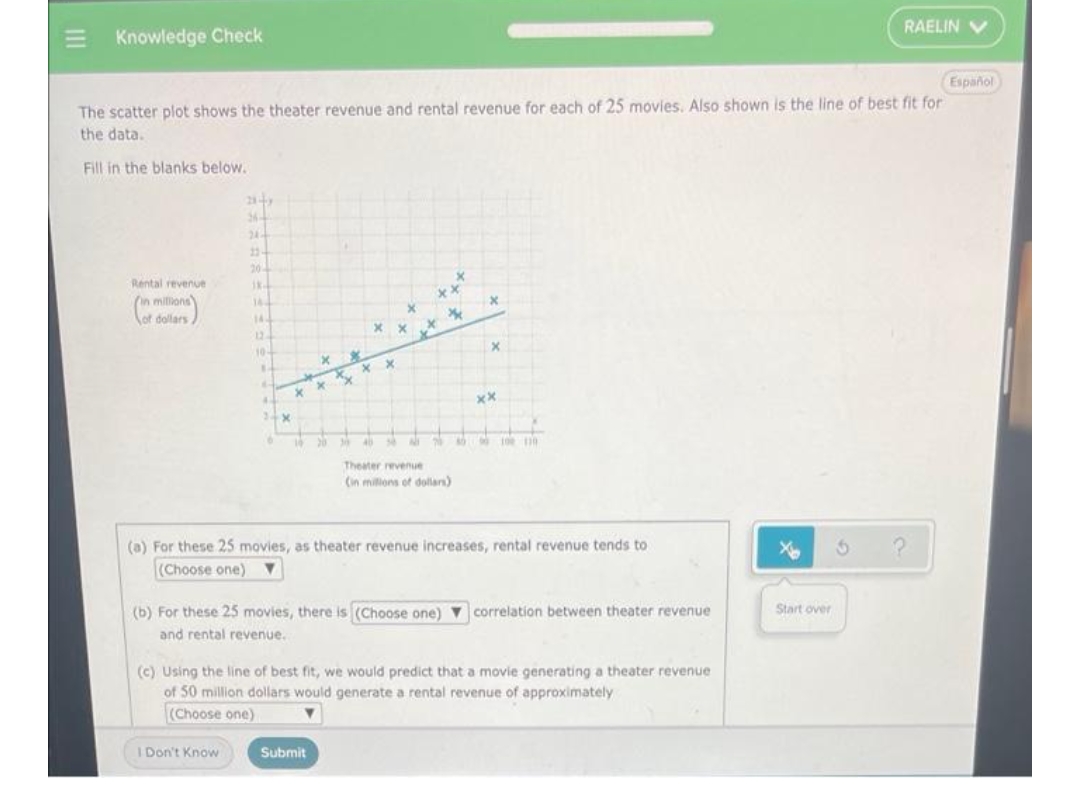
The scatter plot shows the theater revenue and rental revenue for each of 25 movies. Also shown is the line of best fit for
the data.
Fill in the blanks below.
Rental revenue
millions
xx
X
dollars
%
XX X
X
xx
16
90 100 110
Theater revenue
(in millions of dollars)
(a) For these 25 movies, as theater revenue increases, rental revenue tends to
(Choose one) ▼
?
(b) For these 25 movies, there is (Choose one) correlation between theater revenue
and rental revenue.
(c) Using the line of best fit, we would predict that a movie generating a theater revenue
of 50 million dollars would generate a rental revenue of approximately
(Choose one)
I Don't Know
Submit
E
2147
564
24-
20-
18.
14.
12.
10-
1
M
X
X
X
X
20
%
X
X
X
Start over
Expert Solution
This question has been solved!
Explore an expertly crafted, step-by-step solution for a thorough understanding of key concepts.

This is a popular solution!

Trending now
This is a popular solution!

Step by step
Solved in 6 steps

Recommended textbooks for you
Glencoe Algebra 1, Student Edition, 9780079039897…
Algebra
ISBN:
9780079039897
Author:
Carter
Publisher:
McGraw Hill

Holt Mcdougal Larson Pre-algebra: Student Edition…
Algebra
ISBN:
9780547587776
Author:
HOLT MCDOUGAL
Publisher:
HOLT MCDOUGAL
Glencoe Algebra 1, Student Edition, 9780079039897…
Algebra
ISBN:
9780079039897
Author:
Carter
Publisher:
McGraw Hill
Holt Mcdougal Larson Pre-algebra: Student Edition…
Algebra
ISBN:
9780547587776
Author:
HOLT MCDOUGAL
Publisher:
HOLT MCDOUGAL