The scatter plot shows the time spent texting and the time spent exercising by each of 24 students last week. Also shown is the line of best fit for the data. Fill in the blanks below. 13 12 11 10- Time spent 9- exercising (in hours)
The scatter plot shows the time spent texting and the time spent exercising by each of 24 students last week. Also shown is the line of best fit for the data. Fill in the blanks below. 13 12 11 10- Time spent 9- exercising (in hours)

Big Ideas Math A Bridge To Success Algebra 1: Student Edition 2015
1st Edition
ISBN:9781680331141
Author:HOUGHTON MIFFLIN HARCOURT
Publisher:HOUGHTON MIFFLIN HARCOURT
Chapter11: Data Analysis And Displays
Section: Chapter Questions
Problem 8CT

Related questions
Question
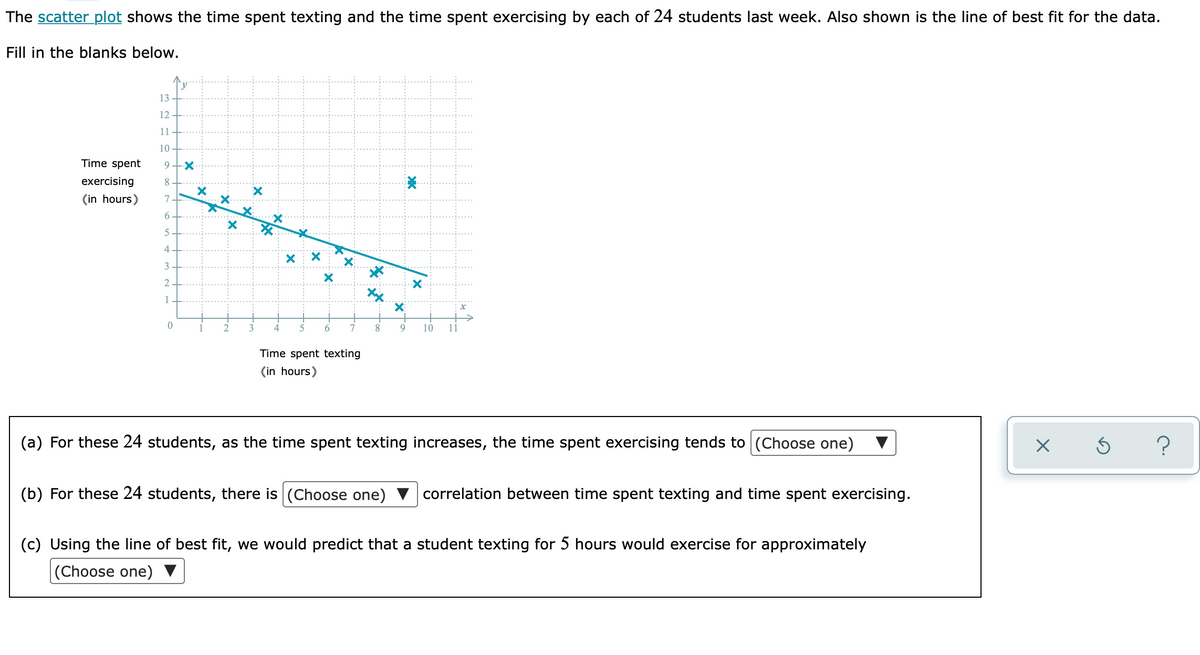
Transcribed Image Text:The scatter plot shows the time spent texting and the time spent exercising by each of 24 students last week. Also shown is the line of best fit for the data.
Fill in the blanks below.
13
12
11
10
Time spent
9
exercising
8.
(in hours)
7
6.
4
3
2
1
1
3
8.
10
11
Time spent texting
(in hours)
(a) For these 24 students, as the time spent texting increases, the time spent exercising tends to (Choose one)
(b) For these 24 students, there is (Choose one)
correlation between time spent texting and time spent exercising.
(c) Using the line of best fit, we would predict that a student texting for 5 hours would exercise for approximately
(Choose one)
X.
Expert Solution
This question has been solved!
Explore an expertly crafted, step-by-step solution for a thorough understanding of key concepts.

This is a popular solution!

Trending now
This is a popular solution!

Step by step
Solved in 2 steps with 1 images

Recommended textbooks for you
Big Ideas Math A Bridge To Success Algebra 1: Stu…
Algebra
ISBN:
9781680331141
Author:
HOUGHTON MIFFLIN HARCOURT
Publisher:
Houghton Mifflin Harcourt

Glencoe Algebra 1, Student Edition, 9780079039897…
Algebra
ISBN:
9780079039897
Author:
Carter
Publisher:
McGraw Hill

Big Ideas Math A Bridge To Success Algebra 1: Stu…
Algebra
ISBN:
9781680331141
Author:
HOUGHTON MIFFLIN HARCOURT
Publisher:
Houghton Mifflin Harcourt
Glencoe Algebra 1, Student Edition, 9780079039897…
Algebra
ISBN:
9780079039897
Author:
Carter
Publisher:
McGraw Hill

Holt Mcdougal Larson Pre-algebra: Student Edition…
Algebra
ISBN:
9780547587776
Author:
HOLT MCDOUGAL
Publisher:
HOLT MCDOUGAL