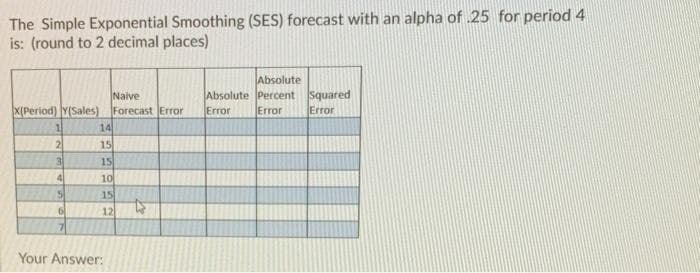
The Simple Exponential Sr is: (round to 2 decimal plae Naive x(Period) Y(Sales) Forecast Error 14


Q: State of the Economy Probability Stock W's Return Recession 0.1 -36% Below Average 0.2 -15% Average…
A: The question relates to portfolio management and requielred to calculate the expected return,…
Q: Given data, • Lead time demand (dl) = 645 pounds • Standard deviation of demand (Olt) = 54pounds •…
A: At a given level of risk, safety stock is calculated by product of the z score of the risk and the…
Q: Required Rate of Return Suppose rRF = 5%, rM = 10%, and rA = 8%. Calculate Stock A's beta. Round…
A: Given, rRf = 5% rM = 10% rA = 8%
Q: Market condition Probability Return on A Good .10 8% Average day .80 10% Bad .10 -45% What is the…
A: To Find: Standard Deviation of A
Q: With risk free rate of 5%, Beta of 2.00, market return of 10%, interest rate for credit 10%, tax…
A: WACC is calculated as weighted cost of equity plus weighted cost of debt
Q: Required Rate of Return Suppose rRF = 5%, rM = 10%, and rA = 11%. Calculate Stock A's beta.…
A: As per CAPM, Return on asset = Risk free Rate + beta * (Market Return - Risk free Rate)
Q: Exercises: a. The standard deviation of returns is 0.30 for Stock A and 0.20 for Stock B. The…
A: Hi, there, Thanks for posting the question. As per our Q&A honour code, we must answer the first…
Q: A-1 BETA COEFFICIENTS AND RATES OF RETURN You are given the following set of data: Historical Rates…
A: Beta of stock is used to measure the risk. It compares the movement of a stock with the movement of…
Q: Assume the risk-free rate is 2%. Calculate the stock's expected return, standard deviation,…
A: Expected rate of return on stock is that rate which an investor can expect to be generated from the…
Q: Calculate the covariance between the following assets [6] State of the world Probability…
A: Calculation of expected return Probability Stock A Stock B Return Expected return Return…
Q: A В 1 Equity A Weighted Weighted Squared State of Rate of Squared Deviation Probability Rate of…
A: expected return is the amount of profit an investor can expect receiving on an investement.
Q: Consider the following information: Rate of Return if State Occurs Probability of State of Economy…
A: Given:
Q: What is the Variance of returns for Security GLO? (no rounding off until the final answer, final…
A: Variance is used as an alternate to measure the absolute risk involved with investment in a security…
Q: Use the following information on states of the economy and stock returns to calculate the expected…
A: The expected return can be computed by multiplying the probability of the state of the economy and…
Q: Year AT&T Stock Returns Market Index Returns 1 8…
A: Characteristic line of stock is the equation to predict stock return for a given market return.…
Q: The following table contains data on market advances and declines. Day Advances Declines Day…
A: Net Advances = Advances -Declines
Q: Consider the following information: Rate of Return If State Occurs Probability of State of State of…
A: Solution:
Q: 1. 1. The average variance of financial assets on a market is 0.4% and the average covariance tween…
A: Hi There, Thanks for posting the questions. As per our Q&A guidelines, must be answered only one…
Q: solve for annualized log-return and annualized volatility of log returns. Last end of day value was…
A: Log Return is required for Statistical Evaluation, If we are having an Average Daily log Return…
Q: Suppose rRF = 4%, rM = 12%, and bi = 1.6. What is ri, the required rate of return on Stock i? Round…
A: In the given question we require to calculate the required return on Stock i : As per Capital assets…
Q: Characteristic Line and Security Market Line You are given the following set of data: Historical…
A: a) Beta co-efficient of a stock can be calculated using the formula as below:…
Q: If D1 = $1.75, g (which is constant) = 5%, and P0 = $50, what is the stock's expected total return…
A: Given information: Dividend for next year (D1) is $1.75 Growth rate is 5% Current year price (P0) is…
Q: Calculate breakeven sales in DOLLARS, while achieving the ROS% target. (Rounding: penny.)
A:
Q: Standard Deviation %
A: To calculate the standard deviation, first we need to calculate the mean of the monthly returns:…
Q: Drawing Examples ven the following information, what is e standard deviation of the returns on is…
A: In this first we have to calculate mean return and deviations from mean and from that.
Q: a) Calculate the NPV assuming 10% discount rate b) Determine in which year will be the payback c)…
A: Net Present Value: It represents the difference between the present worth of annual cash flows and…
Q: 0.15 0.05 001 -0.03 -0.01 0.09 the expected returns of the two stocks? the standard deviations of…
A: The term expected return of stock refers to the profit or loss amount which investor anticipates on…
Q: F G H Monthly Monthly Еxcess Excess return for Market Stock 1 Returns 0.09 0.03 -0.07 0.01 0.02 0.02…
A: Risk and return are two main components of investment. Beta a measure which shows the degree of risk…
Q: - Select your answer - What type of pattern exists in the data? - Select your answer b. Develop the…
A:
Q: Required Rate of ReturnSuppose rRF 5 5%, rM 5 10%, and rA 5 12%.a. Calculate Stock A’s beta.b. If…
A: Given information: Risk free rate (rf) is 5% Market return is (rm) is 10% Required rate of return…
Q: Assume the risk-free rate is 2%. Calculate the stock's expected return, standard deviation,…
A: Here we have to find out expected return by using probability method.
Q: A reasonably good model for stock prices / asset values dS = µSdt+oSdz or ds S where is the expected…
A: GBM ( Geometric Brownian Motion) : It is a continuous-time stochastic process in which the logarithm…
Q: A challenge we run into when forecasting future stock returns is that stock returns compound. So,…
A:
Q: calculate the following Sharpe Ratio (SP) Treynor Measure Jensen Measure M2 measure T2 measure…
A: Note: as per policy, we answer only 3 sub questions under same question. Please repost the…
Q: Consider 1-factor model and assume that the price of a certain fixed income security P(y) for y=9%…
A: To Find: DVO1 Duration Convexity
Q: Table 6-1. Actual Sales Data Time Actual Period Sales 345 378 425 4 450 470 6. 500 7 532 8. 548 9…
A: Forecast by using Exponential smoothing is calculated by using the following formula: Ft = αDt-1 +…
Q: Copy of In each small intorval of time the stock price is assumed to move up by a proportonal amount…
A: the Up and Down move nodes of a binomial tree are found with the help of following formula U = eσ√t…
Q: 6-5. (Standard deviation) Given the following prot Nasional Berhad, find the standard deviation.…
A: The standard deviation is a tool that dictates that how much variance between the average and actual…
Q: What is the standard deviation of Stock B returns given the information below about its returns…
A: Standard Deviation: Standard deviation is a measure of the dispersion of a set of data relative to…
Q: What is ri, the required rate of return on Stock i? Round your answer to one decimal place. % 1.…
A: Given problem relates with SML or Security market line model
Q: Use the following information: Stock A B Good state 10% 14% Bad state 2% -2% Assume there is 60%…
A: Standard deviation is a variation in the mean value of given data. Standard deviation is a…
Q: From the following data calculate the information ratio: Risk free rate: 6% Beta:1.3 Market rate:…
A: Information Ratio refers to the ratio which is used to compare the return of the stocks with their…
Q: 6-2. (Average expected return and risk) Given the holding-period returns shown here, calculate the…
A: Average Expected return: It is the anticipated amount of returns that a portfolio may make . A…
Q: 1)Find the forecast for 2012 using the time series trend method. Period Demand 2007 200 2008 150…
A: Answer 1. Time series trend method:- Time series analysis basically refers to a subset of…
Q: Monthly Excess return for Stock 1 Market returns Monthly Excess 0.09 0.03 -0.07 0.01 0.02 0.02…
A: Beta is the value used to denote riskiness of a security with the market level of returns. It is…
Q: Suppose rRF = 6%, rM = 10%, and bi = 1.8. What is ri, the required rate of return on Stock i? Round…
A: Since you have posted a question with multiple sub-parts, we will solve first three sub-parts for…
Q: Year AT&T Stock Returns Market Index Returns 1 8…
A: Correlation: It shows the relationship between the movement of the return of two stocks or assets…

Step by step
Solved in 2 steps


- A regression line has an intercept value of 174.71 and slope value of 25.22. What is the predicted value (the y-value) in the 100th period (the x-value is 100)? Round to two decimal places.1.) On a single chart, plot the value of $1 invested in each of the five indexes over time. I.e., for all ??, plot the cumulative return series for each index: ?????? = (1 + ?��1)(1 + ?��2)...(1 + ????) What patterns do you observe? (10 points) 2.) Plot a histogram of only the Global index returns. Does the distribution look normal? (5 points) 3.) Estimate the following for each of the indices. In calculating the statistics, “monthly” can be interpreted as “not annualized”. (30 points) a. Arithmetic average of monthly returns, and annualized arithmetic return using the APR method b. Geometric average of monthly returns, and annualized geometric return using the EAR method. Why does the geometric average differ from the arithmetic average? c. Standard deviation of monthly returns, and annualized standard deviation d. Sharpe Ratio of monthly returns, and annualized Sharpe Ratio e. Skewness of monthly returns f. Kurtosis of monthly returns g. 5% Value at Risk (VaR) of…Suppose the returns on an asset are normally distributed. The historical average annual return for the asset was 5.7 percent and the standard deviation was 18.3 percent. a. What is the probability that your return on this asset will be less than –4.1 percent in a given year? Use the NORMDIST function in Excel® to answer this question. (Do not round intermediate calculations and enter your answer as a percent rounded to 2 decimal places, e.g., 32.16.) b. What range of returns would you expect to see 95 percent of the time? (Enter your answers for the range from lowest to highest. A negative answer should be indicated by a minus sign. Do not round intermediate calculations and enter your answers as a percent rounded to 2 decimal places, e.g., 32.16.) c. What range of returns would you expect to see 99 percent of the time? (Enter your answers for the range from lowest to highest. A negative answer should be indicated by a minus sign. Do not round intermediate calculations…
- . Using 625 trading days of data, you estimated the daily log return follows a normal distribution with a mean of 5 bps and and a stdev of 125 bps. Q1a. based on information above, what is the probability of true daily log return average is 0? can you reject the true mean is 0? can you reject the true mean is 10 bps? Q1b. what is the 90, 95, and 99% confidence interval for your mean return estimate? Q1c. what is the mean log return and stdev of log return over one year period and four year period (assuming 252 trading days per year)? Q1d. based on Q1c what is the probably of losing money (negative log return) or doubling your money (total log return = ln(2)) over 1 year and 4 year period?Consider the following time series data: Construct a time series plot. What type of pattern exists in the data? Use a multiple regression model with dummy variables as follows to develop an equation to account for seasonal effects in the data: Qtr1 = 1 if quarter 1, 0 otherwise; Qtr2 = 1 if quarter 2. 0 otherwise; Qtr3 = 1 if quarter 3, 0 otherwise. Compute the quarterly forecasts for next year based on the model you developed in part (b). Use a multiple regression model to develop an equation to account for trend and seasonal effects in the data. Use the dummy variables you developed in part (b) to capture seasonal effects and create a variable t such that t = 1 for quarter 1 in year 1, t = 2 for quarter 2 in year 1, … t = 12 for quarter 4 in year 3. Compute the quarterly forecasts for next year based on the model you developed in part (d). Is the model you developed in part (b) or the model you developed in part (d) more effective? Justify your answer.Consider the following time series data: Construct a time series plot. What type of pattern exists in the data? Develop a three-week moving average for this time series. Compute MSE and a forecast for week 8. Use α = 0.2 to compute the exponential smoothing values for the time series. Compute MSE and a forecast for week 8. Compare the three-week moving average forecast with the exponential smoothing forecast using α = 0.2. Which appears to provide the better forecast based on MSE? Use trial and error to find a value of the exponential smoothing coefficient α that results in a smaller MSE than what you calculated for α = 0.2.
- Stock A has the following returns over the past periods. Calculate the downside risk measured by semi-variance? (answer with 4 decimal spaces) 0.0057 -0.0255 0.0621 -0.0879 -0.0983 0.0813 0.0356 -0.0015 -0.0307 0.0427 0.0297 0.0192uppose the average return on Asset A is 7.1 percent and the standard deviation is 8.3 percent, and the average return and standard deviation on Asset B are 4.2 percent and 3.6 percent, respectively. Further assume that the returns are normally distributed. Use the NORMDIST function in Excel® to answer the following questions. a. What is the probability that in any given year, the return on Asset A will be greater than 12 percent? Less than 0 percent? (Do not round intermediate calculations and enter your answers as a percent rounded to 2 decimal places, e.g., 32.16.) b. What is the probability that in any given year, the return on Asset B will be greater than 12 percent? Less than 0 percent? (Do not round intermediate calculations and enter your answers as a percent rounded to 2 decimal places, e.g., 32.16.) c-1. In a particular year, the return on Asset A was −4.38 percent. How likely is it that such a low return will recur at some point in the future? (Do not round…Suppose the returns on an asset are normally distributed. The historical average annual return for the asset was 5.2 percent and the standard deviation was 10.6 percent. a. What is the probability that your return on this asset will be less than –9.7 percent in a given year? Use the NORMDIST function in Excel® to answer this question. b. What range of returns would you expect to see 95 percent of the time? c. What range of returns would you expect to see 99 percent of the time?
- The past five monthly returns for PG&E are −3.23 percent, 4.03 percent, 3.83 percent, 6.56 percent, and 3.64 percent. Compute the standard deviation of PG&E’s monthly returns. (Do not round intermediate calculations and round your final answer to 2 decimal places.) Standard Deviation %Market Data Return Standard Deviation Beta Market Data 0.120 0.200 1.000 Risk-Free Rate 0.025 0.000 0.000 Company Data A B C Alpha 0.015 0.020 -0.005 Beta 1.200 0.800 1.250 Residual standard deviation, σ(e) 0.105 0.195 0.067 Standard Deviation of Excess Return 0.245 0.235 0.210 Required: Using the data above, please solve for the Sharpe Ratio, Treynor's Measure, and Information Ratio. (Use cells A3 to D10 from the given information to complete this question. Negative answers should be input and displayed as a negative values. All other answers should be input and displayed as positive values.) Risk-Adjusted Performance Measures A B C Market Sharpe Ratio Treynor's Measure Information RatioSuppose the returns on an asset are normally distributed. The historical average annual return for the asset was 6.4 percent and the standard deviation was 12.4 percent. A. What range of returns would you expect to see 95 percent of the time? (Enter your answers for the range from lowest to highest. A negative answer should be indicated by a minus sign. Do not round intermediate calculations and enter your answers as a percent rounded to 2 decimal places, e.g., 32.16.) B. What range of returns would you expect to see 99 percent of the time? (Enter your answers for the range from lowest to highest. A negative answer should be indicated by a minus sign. Do not round intermediate calculations and enter your answers as a percent rounded to 2 decimal places, e.g., 32.16.)