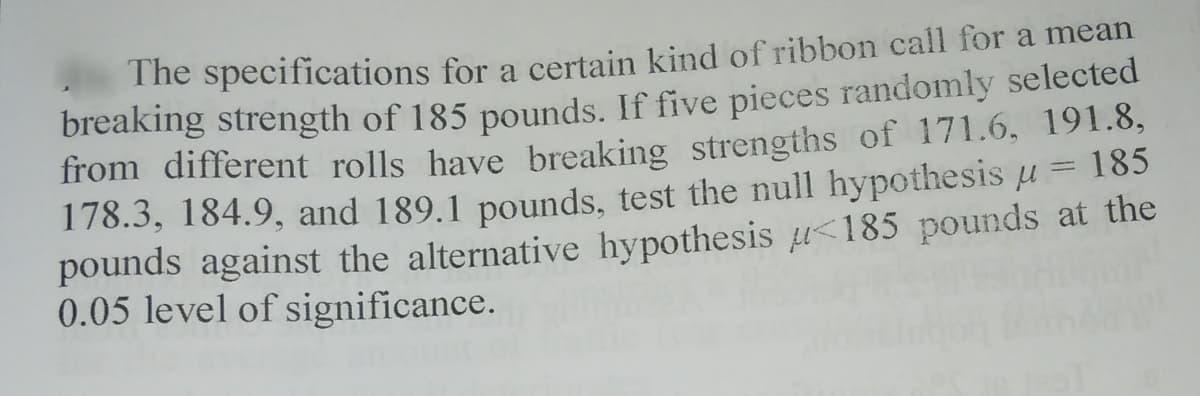
The specifications for a certain kind of ribbon call for a mean breaking strength of 185 pounds. If five pieces randomly selected from different rolls have breaking strengths of 171.6, 191.8, 178.3, 184.9, and 189.1 pounds, test the null hypothesis u = 185 pounds against the alternative hypothesis u<185 pounds at the 0.05 level of significance.
Q: The manager of a computer software company wishes to study the number of hours per week senior…
A: 1. According to the provided data, the null and the alternative hypotheses can be stated as:
Q: A bottle contains a label stating that it contains pills with 500 mg of vitamin C, and another…
A: One contains pills with 325 mg of aspirin while other bottle contains pills with 500 mg of vitamin…
Q: Refer to the accompanying data table, which shows the amounts of nicotine (mg per cigarette) in…
A:
Q: - - The following data were obtained from an indepen- dent-measures research study comparing three…
A: a) The null and alternate hypothesis is H0 : μ1=μ2=μ3HA : Not all the population means are equal…
Q: A hypothesis test is performed at the 10% significance level to determine if the mean student loan…
A: The sample means are 25.1 and 11.8, the sample standard deviations are 5.2 and 2.0.
Q: Refer to the accompanying data table, which shows the amounts of nicotine (mg per cigarette) in…
A: The null and alternative hypothesis are H0: μ1 = μ2 = μ3H1: Any two differ x1 x12 x2 x22 x3 x32…
Q: The specifications for a certain kind of ribbon call for a mean breaking strength of 185 pounds. If…
A: Given: n= 5.0 ,x̄= 184.0 ,s= 6.0 µ= 185.0 ,significance level(∝)= 0.05 ,degree of freedom= 4.0
Q: The health of employees is monitored by periodically weighing them in. A sample of 54 employees has…
A: Given :
Q: For a lower tail hypothesis test with a sample size of 13 and a .10 level of significance, the…
A: From the provided information, Sample size (n) = 13 Level of significance (α) = 0.10 The test is…
Q: Type I error: Washers used in a certain application are supposed to have a thickness of 2…
A: According to the provided information, null hypothesis H0: μ = 2 this means that the thickness of…
Q: A light-bulb manufacturer advertises that the average life for its light bulbs is 900 hours. A…
A:
Q: A bottle contains a label stating that it contains pills with 500 mg of vitamin C, and another…
A: In the given case, the implications of rejecting claims on Aspirin would be more serious as the…
Q: In an experiment involving the breaking strength of a certain type of thread used in personal…
A: Solution: Let X be the strength of thread treated for 60 seconds and Y be the strength of thread…
Q: In building an arena , steel bars with a mean ultimate tensile strength of 400 Megapascal (MPa )…
A: In building an arena , steel bars with a mean ultimate tensile strength of 400 Megapascal (MPa )…
Q: Consider the following data from 11 truck speed data climbing a hilly road. Compute 5 (FIVE) basic…
A: We have to calculate the some summary statistics of the given sample data. Note : According to our…
Q: Use the pulse rates in beats per minute (bpm) of a random sample of adult females listed in the…
A: you had not given data so only first answer is possible from your given data.
Q: Refer to the accompanying data table, which shows the amounts of nicotine (mg per cigarette) in…
A: The claim is that the three categories of cigarettes yield the same mean amount of nicotine.
Q: 1. Consider the following dataset. Compute all quartiles and interquartile range and then draw a…
A: 50 100 103 110 112 114 117 120 123 134 163 167
Q: A researcher was interested in the relationship between a swimmer’s hand length and corresponding…
A: In the given study, there are two variables: a swimmer’s hand length and the time taken to complete…
Q: An agency that hires out clerical workers claims its workers can type, on average, at least 60 words…
A: If the mean typing speed of workers from the agency is less than 60 wpmwpm, the probability of…
Q: FILE The following are three observations collected from treatment 1, five observa- tions collected…
A: answer is explained below
Q: Because of high production-changeover time and costs, a director of manufacturing must convince…
A:
Q: A store that sells LPG claims that the mean weight of their mini-tanks are exactiy 6-kgs as…
A: Dear student as per guidelines we answer the first three subparts only. Please post the other parts…
Q: A researcher was interested in the relationship between a swimmer’s hand length and corresponding…
A: Given information- Significance level, α = 5% Sample size, n = 20 We have to test that a longer hand…
Q: Use the given data to find the minimum sample size required to estimate a population proportion or…
A: The provided information are: Here, the value of population proportion is not given. Thus, sample…
Q: What would be the minimum sample size should I generate to be able to detect a linear correlation…
A:
Q: Refer to the accompanying data table, which shows the amounts of nicotine (mg per cigarette) in…
A: Using Excel Data Analysis, we get:
Q: Because of high production-changeover time and costs, a director of manufacturing must convince…
A:
Q: Suppose the National Transportation Safety Board wants to examine the safety of compact cars,…
A:
Q: A bottle contains a label stating that it contains pills with 500 mg of vitamin C, and another…
A: It is given that a bottle is containing a label statin that it contains pills with 500 mg of vitamin…
Q: A random sample of records of 10 night shifts at the emergency section at the Nairobi hospital gave…
A: Given,Sample size(n)=10sample mean(x)=20.6stndard deviation(s)=2.7968degrees of freedom…
Q: Assume the managers have requested estimates of the mean attitudes towards each mall with a margin…
A: M.E= 0.05 Springdale Mean -3.81 Springdale STDEV - 1.06 West Mall Mean - 3.41 West Mall STDEV - 1.18…
Q: In a survey of smartphone usage, randomly selected users were asked to record their talk time in…
A: Given, Claim: The mean talk time for Smartphone users is less than 14 minutes per day. The…
Q: Follow the steps in Test of Hypothesis and include your conclusion) Two suppliers manufacture a…
A: Given that For supplier 1 Sample size (n1)=10 gears Sample mean =290 Sample standard deviation…
Q: what is the general alternative hypothesis for a two tailed independent samples t test
A: Null and alternative hypotheses: The hypothesis, which is pre assumed as true, tentatively settled…
Q: This chart shows the results of two random samples that measured the average number of minutes per…
A: given Group 1 Sample Mean: 89.35714 Group 1 Sample Standard Deviation: 3.93956 =…
Q: With individual lines at its various windows, a post office claimed that the variance for waiting…
A: The given information is- Population variance = 3.2 So, Population standard deviation = √3.2 =…
Q: Refer to the accompanying data table, which shows the amounts of nicotine (mg per cigarette) in…
A: There are 3 independent samples which are King-Size, 100-mm Menthol and 100-mm Non menthol. The…
Q: Refer to the accompanying data table, which shows the amounts of nicotine (mg per cigarette) in…
A: Given: King-Size Menthol Non-Menthol 1.3 0.9 0.2 1.2 1 1.1 1 1.2 0.6 1.1 0.9 1.2 1.5…
Q: Listed below are head injury data from crash test dummies used in cars of various sizes. These…
A: Anova is an extension of two independent t test. It is a type of parametric test. It has the…
Q: Refer to the accompanying data table, which shows the amounts of nicotine (mg per cigarette) in…
A:
Q: Suppose a sample of adults revealed data regarding whether or not a person who smokes also has a…
A: Given Data: Smoker Non-Smoker Total Has a Tattoo 35 70 105 Doesn't have a tattoo 20 85 105…
Q: In a bumper test, three test vehicles of each of three types of autos were crashed into a barrier at…
A: An experimental design is a way to carefully plan experiments in advance so that the…
Q: Refer to the accompanying data table, which shows the amounts of nicotine (mg per cigarette) in…
A: Note: " Since you have posted many sub-parts. we will solve the first three sub-parts for you. To…
Q: The south African department of health is concerned that the average percentage mark-up on a…
A: HERE GIVEN FOR MARK UP ON PRODUCT PRICE DUE TO COVID 19. SOUTH AFRICA HEALTH DEPARTMENT BELIVES THAT…
Q: From performing a hypothesis test to determine if judge1 differs from judge2 in the mean of sentence…
A:
Q: Five samples of a ferrous-type substance were used to determine if there is a difference between a…
A: Excel Procedure: Enter X ray and Chemical in Excel sheet>Data>Data Analysi>‘t-Test:…
Q: Refer to the accompanying data table, which shows the amounts of nicotine (mg per cigarette) in…
A: The data given is as follows King size 100 mm Menthol 100 mm Nonmenthol 1.3 1.1 0.8 1.1 1 1…
Q: Use the pulse rates in beats per minute of a random sample of adult females listed in the data set…
A: For the given data; n=50Mean=66.32SD=19.2507 Null and alternate hypothesis is-…
Q: It has been estimated that the 1991 G-car obtains a mean of 35 miles per gallon on the highway, and…
A: (a). Assume, x be the random variable representing the mileage of cars in miles per gallon. μ be…
Trending now
This is a popular solution!
Step by step
Solved in 2 steps with 2 images
- What is meant by the sample space of an experiment?What is a sample space?A grassroots group opposed to a proposed increase in the gas tax claimed that the increase would hurt working-class people the most, since they commute the farthest to work. Suppose that the group randomly surveyed 24 individuals and asked them their daily one-way commuting mileage. The results are in Table below. Using a 5% significance level, test the hypothesis that the three mean commuting mileages are the same. working-class professional (middle incomes) professional (wealthy) 17.8 16.5 8.5 26.7 17.4 6.3 49.4 22.0 4.6 9.4 7.4 12.6 65.4 9.4 11.0 47.1 2.1 28.6 19.5 6.4 15.4 51.2 13.9 9.3
- The table below summarizes data from a survey of a sample of women. Using a 0.01 significance level, and assuming that the sample sizes of 900 men and 400 women are predetermined, test the claim that the proportions of agree/disagree responses are the same for subjects interviewed by men and the subjects interviewed by women. Does it appear that the gender of the interviewer affected the responses of women?The table below summarizes data from a survey of a sample of women. Using a 0.05 significance level, and assuming that the sample sizes of 900 men and 400 women are predetermined, test the claim that the proportions of agree/disagree responses are the same for subjects interviewed by men and the subjects interviewed by women. Does it appear that the gender of the interviewer affected the responses of women? Gender of Interviewer Man Woman Women who agree 532 349 Women who disagree 368 51 Identify the null and alternative hypotheses. Compute the test statistic. Find the critical value(s). What is the conclusion based on the hypothesis test? Reject or fail to reject? Is there sufficient evidence? Does it appear that the gender of the interviewer affected the responses of women?Since an instant replay system for tennis was introduced at a major tournament, men challenged 1439 referee calls, with the result that 422 of the calls were overturned. Women challenged 742 referee calls, and 216 of the calls were overturned. Use a 0.01 significance level to test the claim that men and women have equal success in challenging calls. Complete parts (a) through (c) below.
- Since an instant replay system for tennis was introduced at a major tournament, men challenged 1435 referee calls, with the result that 413 of the calls were overturned. Women challenged 748referee calls, and 222 of the calls were overturned. Use a 0.01 significance level to test the claim that men and women have equal success in challenging calls. Complete parts (a) through (c) below.To test the fairness of law enforcement in its area, a local citizens’ group wants to know whether women and men are unequally likely to get speeding tickets. Four hundred randomly selected adults were phoned and asked whether or not they had been cited for speeding in the last year. Using the results in the following table and a 0.10 level of significance, test the claim of the citizens’ group. Let men be Population 1 and let women be Population 2. Speeding Tickets Ticketed Not Ticketed Men 12 183 Women 30 175 Copy Data Step 2 of 3 : Compute the value of the test statistic. Round your answer to two decimal places.The table below summarizes data from a survey of a sample of women. Using a 0.01 significance level, and assuming that the sample sizes of 800 men and 300 women are predetermined, test the claim that the proportions of agree/disagree responses are the same for subjects interviewed by men and the subjects interviewed by women. Does it appear that the gender of the interviewer affected the responses of women? Gender of Interviewer Man Woman Women who agree 534 264 Women who disagree 266 36 B. Compute the test statistic. ____ C. Find the critical value(s).___,_____ c2. What is the conclusion based on the hypothesis test? (Fail to reject/ Reject) H0. There (is/is not) sufficient evidence to warrant rejection of the claim that the proportions of agree/disagree responses are the same for subjects interviewed by men and the subjects interviewed by women. It…
- The table below summarizes data from a survey of a sample of women. Using a 0.05 significance level, and assuming that the sample sizes of 800 men and 400 women are predetermined, test the claim that the proportions of agree/disagree responses are the same for subjects interviewed by men and the subjects interviewed by women. Does it appear that the gender of the interviewer affected the responses of women? Gender of Interviewer Man Woman Women who agree 535 344 Women who disagree 265 56 Click here to view the chi-square distribution table. LOADING... Identify the null and alternative hypotheses. Choose the correct answer below. A. H0: The proportions of agree/disagree responses are different for the subjects interviewed by men and the subjects interviewed by women. H1: The proportions are the same. B. H0: The proportions of agree/disagree…The table below summarizes data from a survey of a sample of women. Using a 0.05 significance level, and assuming that the sample sizes of 700 men and 300 women are predetermined, test the claim that the proportions of agree/disagree responses are the same for subjects interviewed by men and the subjects interviewed by women. Does it appear that the gender of the interviewer affected the responses of women? Gender of Interviewer Man Woman Women who agree 487 235 Women who disagree 213 65 Identify the null and alternative hypotheses. Choose the correct answer below. A. H0: The proportions of agree/disagree responses are the same for the subjects interviewed by men and the subjects interviewed by women. H1: The proportions are different. B. H0: The proportions of agree/disagree responses are different for the subjects interviewed by men and the subjects interviewed by women. H1: The…The table below summarizes data from a survey of a sample of women. Using a 0.01 significance level, and assuming that the sample sizes of 700 men and 300 women are predetermined, test the claim that the proportions of agree/disagree responses are the same for subjects interviewed by men and the subjects interviewed by women. Does it appear that the gender of the interviewer affected the responses of women? Gender of Interviewer Man Woman Women who agree 482 237 Women who disagree 218 63 Identify the null and alternative hypotheses. Compute the test statistic. Find the critical value(s). What is the conclusion based on the hypothesis test?