A data set includes the counts of chocolate chips from three different types of Chips Ahoy cookies. The accompanying StatCrunch display shows results from analysis of variance used with those three types of cookies. Use a 0.05 significance level to test the claim that the three different types of cookies have the same mean number of chocolate chips. ANOVA table Source DF SS MS F-Stat P-value Columns 2 1166.0000 583.00000 59.1358 <0.0001 Error 77 759.11667 9.8586581 Total 79 1925.1167 Question content area bottom Part 1 Determine the null hypothesis. H0: ▼ mu 1 less than mu 2 less than mu 3μ1<μ2<μ3 At least one of the means is different from the othersAt least one of the means is different from the others All of the means are differentAll of the means are different mu 1 greater than mu 2 greater than mu 3μ1>μ2>μ3 mu 1 equals mu 2 equals mu 3μ1=μ2=μ3 Part 2 Determine the alternative hypothesis. H1: ▼ At least one of the means is different from the othersAt least one of the means is different from the others mu 1 less than mu 2 less than mu 3μ1<μ2<μ3 All of the means are differentAll of the means are different mu 1 greater than mu 2 greater than mu 3μ1>μ2>μ3 mu 1 equals mu 2 equals mu 3μ1=μ2=μ3 Part 3 Determine the test statistic. The test statistic is enter your response here. (Round to two decimal places as needed.) Part 4 Determine the P-value. The P-value is enter your response here. (Round to three decimal places as needed.)
A data set includes the counts of chocolate chips from three different types of Chips Ahoy cookies. The accompanying StatCrunch display shows results from analysis of variance used with those three types of cookies. Use a 0.05 significance level to test the claim that the three different types of cookies have the same mean number of chocolate chips. ANOVA table Source DF SS MS F-Stat P-value Columns 2 1166.0000 583.00000 59.1358 <0.0001 Error 77 759.11667 9.8586581 Total 79 1925.1167 Question content area bottom Part 1 Determine the null hypothesis. H0: ▼ mu 1 less than mu 2 less than mu 3μ1<μ2<μ3 At least one of the means is different from the othersAt least one of the means is different from the others All of the means are differentAll of the means are different mu 1 greater than mu 2 greater than mu 3μ1>μ2>μ3 mu 1 equals mu 2 equals mu 3μ1=μ2=μ3 Part 2 Determine the alternative hypothesis. H1: ▼ At least one of the means is different from the othersAt least one of the means is different from the others mu 1 less than mu 2 less than mu 3μ1<μ2<μ3 All of the means are differentAll of the means are different mu 1 greater than mu 2 greater than mu 3μ1>μ2>μ3 mu 1 equals mu 2 equals mu 3μ1=μ2=μ3 Part 3 Determine the test statistic. The test statistic is enter your response here. (Round to two decimal places as needed.) Part 4 Determine the P-value. The P-value is enter your response here. (Round to three decimal places as needed.)

Glencoe Algebra 1, Student Edition, 9780079039897, 0079039898, 2018
18th Edition
ISBN:9780079039897
Author:Carter
Publisher:Carter
Chapter10: Statistics
Section10.5: Comparing Sets Of Data
Problem 14PPS

Related questions
Question
A data set includes the counts of chocolate chips from three different types of Chips Ahoy cookies. The accompanying StatCrunch display shows results from analysis of variance used with those three types of cookies. Use a
0.05
significance level to test the claim that the three different types of cookies have the same mean number of chocolate chips.
|
Question content area bottom
Part 1
Determine the null hypothesis.
H0:
▼
mu 1 less than mu 2 less than mu 3μ1<μ2<μ3
At least one of the means is different from the othersAt least one of the means is different from the others
All of the means are differentAll of the means are different
mu 1 greater than mu 2 greater than mu 3μ1>μ2>μ3
mu 1 equals mu 2 equals mu 3μ1=μ2=μ3
Part 2
Determine the alternative hypothesis.
H1:
▼
At least one of the means is different from the othersAt least one of the means is different from the others
mu 1 less than mu 2 less than mu 3μ1<μ2<μ3
All of the means are differentAll of the means are different
mu 1 greater than mu 2 greater than mu 3μ1>μ2>μ3
mu 1 equals mu 2 equals mu 3μ1=μ2=μ3
Part 3
Determine the test statistic.
The test statistic is
enter your response here.
(Round to two decimal places as needed.)
Part 4
Determine the P-value.
The P-value is
enter your response here.
(Round to three decimal places as needed.)
p value, x2, t test, conclusion and confidence Interval
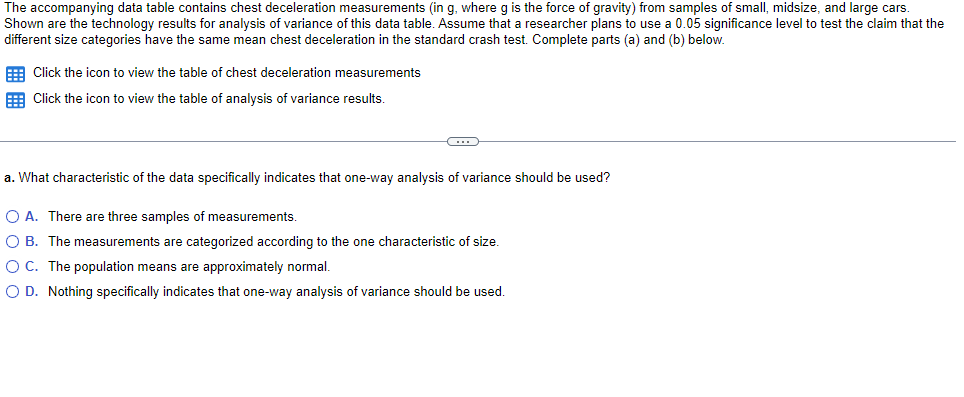
Transcribed Image Text:The accompanying data table contains chest deceleration measurements (in g, where g is the force of gravity) from samples of small, midsize, and large cars.
Shown are the technology results for analysis of variance of this data table. Assume that a researcher plans to use a 0.05 significance level to test the claim that the
different size categories have the same mean chest deceleration in the standard crash test. Complete parts (a) and (b) below.
E Click the icon to view the table of chest deceleration measurements
E Click the icon to view the table of analysis of variance results.
a. What characteristic of the data specifically indicates that one-way analysis of variance should be used?
O A. There are three samples of measurements.
O B. The measurements are categorized according to the one characteristic of size.
O C. The population means are approximately normal.
O D. Nothing specifically indicates that one-way analysis of variance should be used.
Expert Solution
This question has been solved!
Explore an expertly crafted, step-by-step solution for a thorough understanding of key concepts.

This is a popular solution!

Trending now
This is a popular solution!

Step by step
Solved in 2 steps

Recommended textbooks for you
Glencoe Algebra 1, Student Edition, 9780079039897…
Algebra
ISBN:
9780079039897
Author:
Carter
Publisher:
McGraw Hill
Glencoe Algebra 1, Student Edition, 9780079039897…
Algebra
ISBN:
9780079039897
Author:
Carter
Publisher:
McGraw Hill