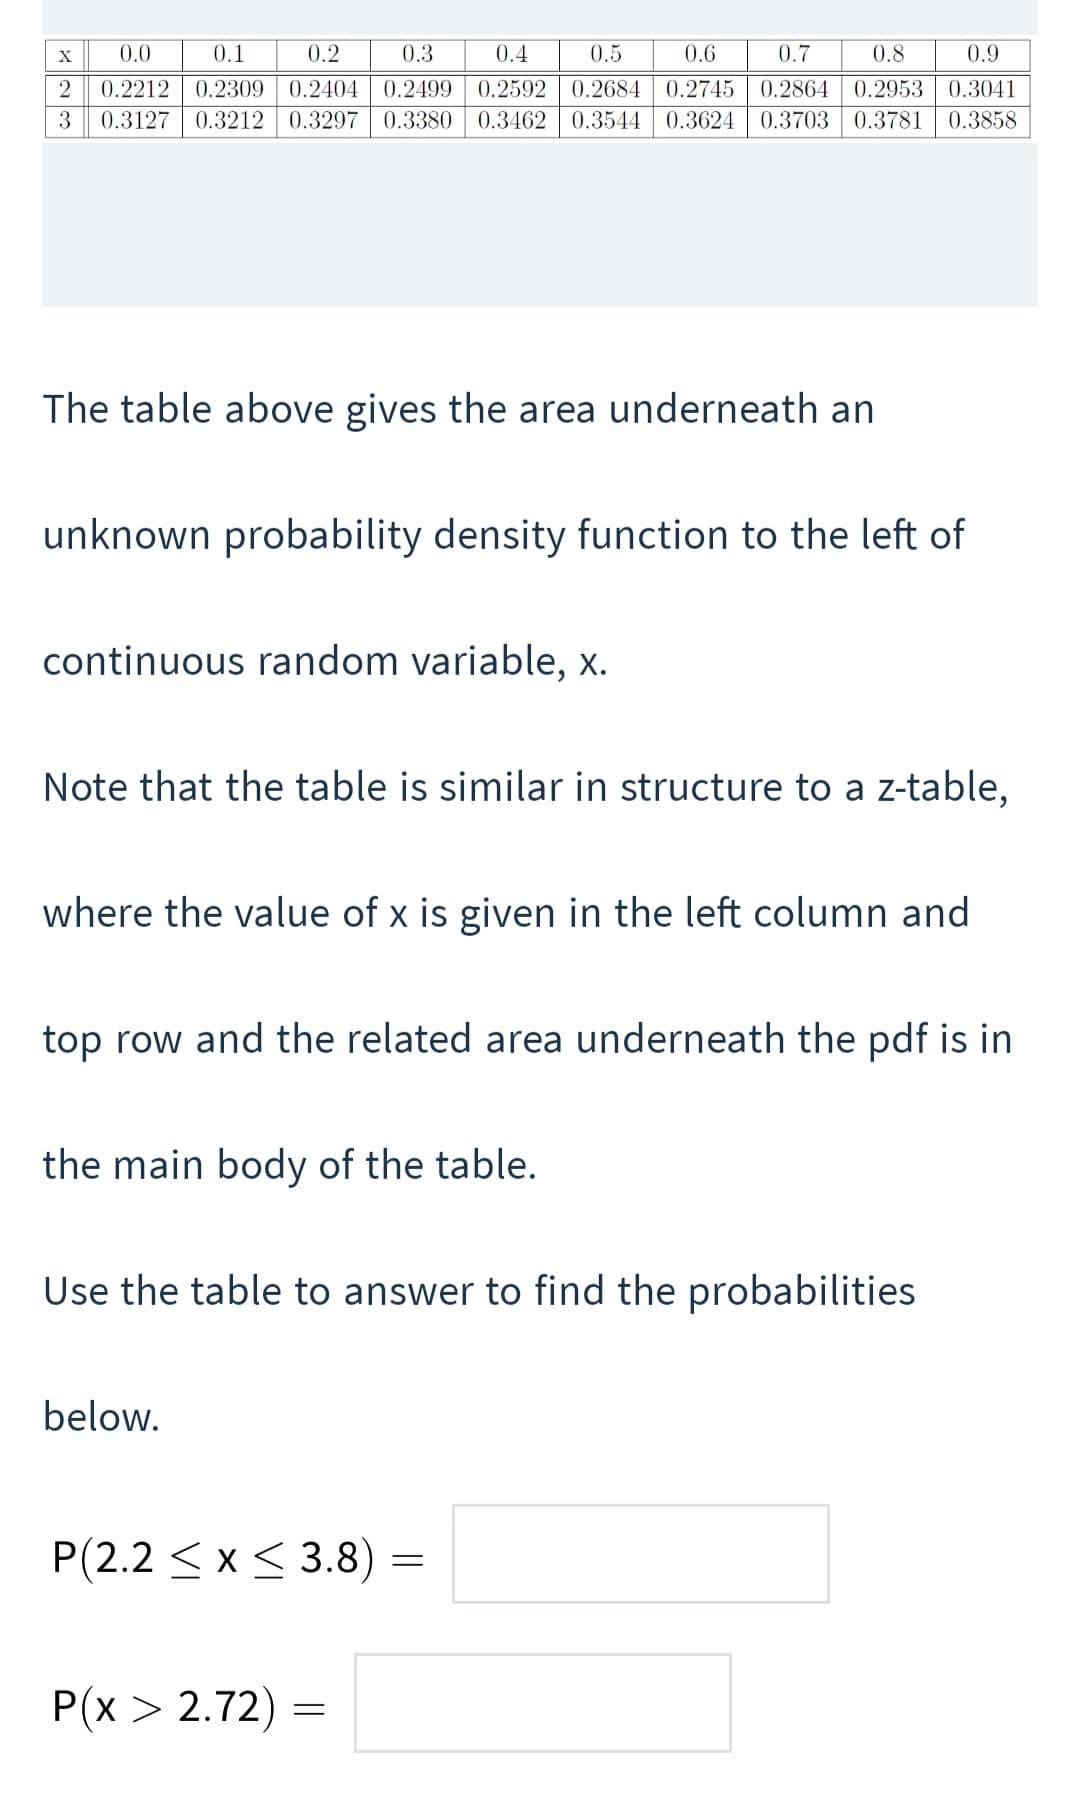
The table above gives the area underneath an unknown probability density function to the left of continuous random variable, x. Note that the table is similar in structure to a z-tabl where the value of x is given in the left column and top row and the related area underneath the pdf is the main body of the table. Use the table to answer to find the probabilities below. P(2.2 < x< 3.8) P(x > 2.72)
Q: In a large sample of customer accounts, a utility company determined that the average number of days...
A:
Q: 15 cards are selected out of a 52 card deck such that after each card is selected, it is placed back...
A: Select whether the given statement is true or false
Q: 2. Which of the following illustrate(s) inferential statistics? I. Using data from the 2000 Family I...
A: Inferential statistics is involved in drawing inferences about the population from the sample, which...
Q: Lunch break: In a recent survey of 655 working Americans ages 25 - 34, the average weekly amount spe...
A: The mean of 45.84 and standard deviation of 3.07.
Q: M In a random sample of 740 Americans, 38% indicated that they have a cat for a pet. Estimate with 9...
A:
Q: A random sample of 36 values is drawn from a mound-shaped and symmetric distribution. The sample mea...
A: For the given data, Perform one sample t-test
Q: In a recent poll, the Gallup Organization found that 45% of adult Americans believe that the overall...
A: Hey there! Thank you for posting the question. Since your question has more than 3 parts, we are sol...
Q: In a shipment of 25 hard disks, six are defective. If five of the disks are selected at random, what...
A:
Q: How large a sample should she take to achieve this? Please carry answers to at least six decimal pla...
A: Given: sample size, n=332 number of people have flu, x=36 Margin of error, E=0.03 confidence level=9...
Q: In the following probability distribution, the random variable x represents the number of activities...
A: Solution-: As per our guidelines we can solve first three sub part of question and rest can be repos...
Q: population has a mean of 75 and a standard deviation of 15 (a) what is the mean of the sampling dis...
A:
Q: 1. Which of the following notations indicate the probability of a z value from the right? A. P(Z > z...
A:
Q: A recent report by PEW Research Center, published on February 25, 2022 summarizes American views on ...
A: Introduction: Denote X as the number of adults who consider the military buildup to be a major or mi...
Q: helps patients attain a lower plasma glucose level than an insulin pump? Follow 32 adolescent patien...
A:
Q: The following table provides a probability distribution for the random variable x. f(x) 8 0.25 16 0....
A: Let X be the random variable having probability mass function is, X f(x) or p(x) 8 0.25 16 ...
Q: ersons lived during a calendar year and the number of deaths recorded during the re as follows: Age ...
A: Crude Death Rate is used to measure the mortality of the given population. It is defined as the numb...
Q: Marks obtained by 9 students in statistics are given below : 52, 75, 40, 70, 43, 40, 65, 35, 48. Cal...
A:
Q: Question 4 The formula for the degrees of freedom for the single-sample t test is: O (N - 1)(N - 1)....
A: what will be the degree of freedom in single sampling t- test ?
Q: Using your own words, discuss how a correlated-groups t test has more statistical power in compariso...
A:
Q: 3. representative sample of a The numerical summary provided suggests that the distribution of blood...
A:
Q: Calculate the probable outlier data points.
A: Lower quartile = 13 Upper quartile = 24.5
Q: To test the desirability of a certain modification in typists, desks, 9 typists were given two tests...
A:
Q: A ski company in Vail owns two ski shops, one on the west side and one on the east side of Vail. Ski...
A: The claim is that there is a significant difference in sales dollars of hats between the west side a...
Q: At what level are the following variables measured? _______________ 1. The scores of students in a s...
A: Solution-: At what level are the following variables measured?
Q: The purpose of the study conducted by Anim-Nyame et al. in 2011 was to examine the ascorbic acid lev...
A: We will use Two way ANOVA with Replication. Hi! Thank you for the question, As per the honor code, w...
Q: Researchers conducted a study of smartphone use among adults. A cell phone company claimed that iPho...
A: . Find a 95% confidence interval for the difference in proportions between white and African America...
Q: Calculate a point estimate of the population correlation coefficient between Cl AMIA and Co AMIA ...
A: Given: Subj Clockwise(Cl) Counterclockwise(Co) 1 57.9 43.2 2 35.7 52.1 3 54.5 59.2 4 56.8...
Q: As part of an experiential learning project, a group of ECON 227 students conducts an in-depth inter...
A: Given data is Customers served(x) probability 0 0.10 1 0.15 2 0.30 3 0.20 4 0.15 5 0...
Q: I want to be sure to obtain a margin of error of ±5 % in a poll asking whether people support univer...
A: Given information: Margin of Error=+/-5%=0.05 Let level of significance=0.05 Let the proportion of p...
Q: (a) Find P(r = 0). (b) Find P(r ≥ 1) by using the complement rule.
A:
Q: Property 5. If X is some r.v. with characteristic function ox (t), and if u,' = E (X) exists, then H...
A:
Q: 5. Which of the following statements describe the concepts of empiriica rule? A. It states that the ...
A: Empirical rules:1) P(μ-σ<X<μ+σ)≅68%2) P(μ-2σ<X<μ+2σ)≅95%3) P(μ-3σ<X<μ+3σ)≅99.70%
Q: .5 .25 1.4 1.5 .85 .20 1.5 1.75 .10 .65 .75 1.10 1.65 1.4 .6 .35 .40 .25 a. What is the mean number ...
A: Given: 0.5 0.2 0.75 1.4 0.25 1.5 2 0.6 1.4 1.75 1 0.35 1.5 0.1 1.1...
Q: . Regression equation in standard format . What percent of variation in revenues can be accounted fo...
A: Hi! Thank you for the question, As per the honor code, we are allowed to answer first three subparts...
Q: What does the standard deviation measure?
A:
Q: What is the probability of flipping a quarter four times and it landing on Tails each time? Leave yo...
A: The outcomes of flipping a quarter are {Head, Tail}.
Q: In a 1992 article in the Journal of the American Medical Association, researchers reported that a mo...
A:
Q: Bree and Kendra love to go to the movies. When they go, there is a probability of 0.3 that Bree wil...
A:
Q: 4. VariablesM and N are O A. both qualitative O B. both quantitative O C. quantitative and qualitati...
A: In the specified problem, the variables, which are used here to study the characteristics of the pat...
Q: From the tollowing data tind out whether there is any relationship between sex and preference for co...
A:
Q: Question 1. a) Consider an experiment which measures the value of three different vari- ables on a u...
A: "Since you have asked multiple questions, we will solve the first question for you. If you want any ...
Q: Here is the Minitab result for the mean ideal BMI for women (top) and men (bottom):5 One-sample T N...
A: We have given that N=40 Mean=18.850 Stdev= 1.750
Q: A part of the Life Table of a population is given hereunder with incomplete information. Find those ...
A:
Q: Given the following measurements from the length of the table: L1 = 3.65 m, L2 = 3.67 m, and L3 = 3....
A:
Q: 15. The velocities of cars in express way are normally distributed with a Mean of 90 km/hr and stand...
A: Given,mean(μ)=90standard deviation(σ)=10Z-score=2.5
Q: Express the confidence interval 0.175 + 0.064 in open interval form (i.e., (0.155,0.855), Question H...
A:
Q: The article, Remdesivir in adults with severe COVID-19: a randomised, double-blind, placebo-controll...
A: Introduction: A total of 237 patients were considered for the study.
Q: Suppose, in a car shop, the number of cars sold by a salesman follows a probability distribution wit...
A: Given Suppose, in a car shop, the number of cars sold by a salesman follows a probability distributi...
Q: A. Use Empirical rule to complete the following table. Write on the respective column the range or i...
A: Given the mean and standard deviation in the table. We need to fill the table with 68%, 95% snd 99.7...
Q: The table below shows the relationship between the altitude of the atmosphere and corresponding temp...
A: Given that, the relationship between the altitude of the atmosphere and corresponding temperature. ...
Trending now
This is a popular solution!
Step by step
Solved in 2 steps with 4 images
- Data collected by a price reporting agency from more than 90,000 gasoline and convenience stores throughout the U.S. showed that the average price for a liter of unleaded gasoline was $0.87. The following data show the price per liter ($) for a sample of 20 gasoline and convenience stores located in San Francisco. 0.97 0.97 1.29 0.92 0.96 0.96 0.98 0.93 1.01 0.96 0.96 0.97 0.96 1.03 1.12 0.95 0.94 1.01 0.93 0.92 (a) Use the sample data to estimate the mean price in dollars for a liter of unleaded gasoline in San Francisco. (Round your answer to three decimal places.) (b) Compute the sample standard deviation in dollars. (Round your answer to three decimal places.) (c) Compare the mean price per liter for the sample data to the national average price. What conclusions can you draw about the cost of living in San Francisco? The average price for a liter of unleaded gasoline in San Francisco is lower than/higher than/same as the national average. This indicates…Data collected by a price reporting agency from more than 90,000 gasoline and convenience stores throughout the U.S. showed that the average price for a liter of unleaded gasoline was $0.87. The following data show the price per liter ($) for a sample of 20 gasoline and convenience stores located in San Francisco. 0.97 0.97 1.25 0.92 0.92 1.00 0.94 0.97 1.01 0.96 0.96 0.97 0.92 1.03 1.12 0.95 0.98 0.97 0.97 0.96 (a) Use the sample data to estimate the mean price in dollars for a liter of unleaded gasoline in San Francisco. (Round your answer to three decimal places.) $ (b) Compute the sample standard deviation in dollars. (Round your answer to three decimal places.) $ (c) Compare the mean price per liter for the sample data to the national average price. What conclusions can you draw about the cost of living in San Francisco? The average price for a liter of unleaded gasoline in San Francisco is the national average. This indicates that the cost of living in San…The following data was reported on total Fe for four types of iron formation (1 = carbonate, 2 = silicate, 3 = magnetite, 4 = hematite). 1: 20.3 28.1 27.8 27.0 27.5 25.2 25.3 27.1 20.5 31.2 2: 26.1 24.0 26.2 20.2 23.9 34.0 17.1 26.8 23.7 24.8 3: 30.2 34.0 27.5 29.4 28.4 26.2 29.9 29.5 30.0 36.1 4: 36.3 44.2 34.1 30.3 32.0 33.1 34.1 32.9 36.3 25.3 Carry out an analysis of variance F test at significance level 0.01. State the appropriate hypotheses. H0: ?1 = ?2 = ?3 = ?4 Ha: all four ?i's are unequal H0: ?1 = ?2 = ?3 = ?4 Ha: at least two ?i's are unequal H0: ?1 ≠ ?2 ≠ ?3 ≠ ?4 Ha: all four ?i's are equal H0: ?1 ≠ ?2 ≠ ?3 ≠ ?4 Ha: at least two ?i's are equal Summarize the results in an ANOVA table. (Round your answers two decimal places.) Source df Sum ofSquares MeanSquares f Treatments Error Total Give the test statistic. (Round your answer to two decimal places.)f = What can be said about the P-value for the test? P-value >…
- The following data was reported on total Fe for four types of iron formation (1 = carbonate, 2 = silicate, 3 = magnetite, 4 = hematite). 1: 20.6 28.1 27.8 27.0 27.9 25.2 25.3 27.1 20.5 31.2 2: 26.5 24.0 26.2 20.2 23.6 34.0 17.1 26.8 23.7 24.8 3: 30.2 34.0 27.5 29.4 28.3 26.2 29.9 29.5 30.0 35.8 4: 36.6 44.2 34.1 30.3 32.0 33.1 34.1 32.9 36.3 25.2 Carry out an analysis of variance F test at significance level 0.01. State the appropriate hypotheses. H0: ?1 ≠ ?2 ≠ ?3 ≠ ?4Ha: at least two ?i's are equalH0: ?1 = ?2 = ?3 = ?4Ha: all four ?i's are unequal H0: ?1 ≠ ?2 ≠ ?3 ≠ ?4Ha: all four ?i's are equalH0: ?1 = ?2 = ?3 = ?4Ha: at least two ?i's are unequal Summarize the results in an ANOVA table. (Round your answers two decimal places.) Source df Sum ofSquares MeanSquares f Treatments Error Total Give the test statistic. (Round your answer to two decimal places.)There was a compete e^AT partA mining company finds that daily lost-work injuries averages to 1.2. If the local union contract has a clause requiring that the mine be shut down as soon as three workers incur lost-work injuries, on what percentage of the days will the mine be operational throughout the day?
- The following data has been collected on the interarrival times of patients to an emergency department: 3.772, 1.761, 0.743, 15.988, 0.412, 7.541, 6.900, 3.447, 7.024, 1.061, 5.449, 0.309, 0.766, 4.807, 8.143, 0.093, 9.524, 0.012, 4.634, and 0.195 minutes. Estimate the squared coefficient of variation of the arrival process. Is the arrival process likely to be Poisson? Why or why not? Estimate the arrival rate?A sample of rental cars showed the following annual mileage (in thousands of miles) 46.768 34.813 69.194 36.927 57.666 36.003 42.961 37.194 47.750 41.738 44.239 34.052 31.731 54.661 30.928 47.847 31.286 38.813 40.166 32.905 42.057 49.834 47.556 37.729 22.120 40.822 41.104 62.399 32.550 43.558 10 The sum of squared miles is, a 60749.96 b 58980.55 c 57262.67 d 55594.82Following are the quantities and prices for the years 2010 and 2018 for Kinzua Valley Geriatrics. Use 2010 as the base period. 2010 2018ItemPriceQuantity PriceQuantitySyringes (dozen)$6.94 1,332 $6.18 1,957 Thermometers 8.32 5 16.38 15 Advil (bottle) 4.69 283 8.89 295 Patient record forms (box) 6.19 924 9.82 1,027 Copier paper (box) 10.48 55 25.96 81 %media:2excel.ext% Click here for the Excel Data File a. Determine the simple price indexes. (Round your answers to 2 decimal places.) b. Determine the simple aggregate price index for the two years. (Round your answer to 2 decimal places.) c. Determine the Laspeyres price index. (Round your answer to 2 decimal places.) d. Determine the Paasche price index. (Round your answer to 2 decimal places.) e. Determine Fisher's ideal index. (Round your answer to 2 decimal places.).
- The following are the drying times (minutes) of 100sheets coated with polyurethane under various ambientconditions:45.6 50.3 55.1 63.0 58.2 65.5 51.1 57.4 60.4 54.956.1 62.1 43.5 63.8 64.9 59.9 63.0 67.7 53.8 57.961.8 52.2 61.2 51.6 58.6 73.8 53.9 64.1 57.2 75.455.9 70.1 46.2 63.6 56.0 48.1 62.2 58.8 50.8 68.151.4 73.9 66.7 42.9 71.0 56.1 60.8 58.6 70.6 62.259.9 47.5 72.5 62.0 56.8 54.3 61.0 66.3 52.6 63.564.3 63.6 53.5 55.1 62.8 63.3 64.7 54.9 54.4 69.664.2 59.3 60.6 57.1 68.3 46.7 73.7 56.8 62.9 58.468.5 68.9 62.1 62.8 74.4 43.8 40.0 64.4 50.8 49.955.8 66.8 67.0 64.8 57.6 68.3 42.5 64.4 48.3 56.5Construct a frequency distribution of these data, usingeight classes.Suppose the price per share of stock for a sample of 25 companies was recorded at the beginning of the first financial quarter and then again at the end of the first financial quarter. How stocks perform during the first financial quarter is an indicator of what is ahead for the stock market and the economy. Company End of 1st quarter Beginning of 1st quarter Company 1 54.69 55.32 Company 2 56.20 78.52 Company 3 103.07 110.50 Company 4 80.45 85.08 Company 5 126.51 140.73 Company 6 133.23 137.28 Company 7 32.56 42.57 Company 8 51.41 54.54 Company 9 35.90 37.94 Company 10 14.55 19.48 Company 11 33.04 40.04 Company 12 45.33 40.36 Company 13 185.13 189.53 Company 14 109.28 109.45 Company 15 72.46 92.15 Company 16 49.32 55.03 Company 17 36.70 43.73 Company 18 79.57 86.18 Company 19 95.50 87.45 Company 20 43.09 47.09 Company 21 51.32 66.70 Company 22 77.45 86.53 Company 23 46.77 45.99 Company 24 46.45 48.13 Company 25 130.36 129.08 (a)…A sample of rental cars showed the following annual mileage (in thousands of miles) 46.768 34.813 69.194 36.927 57.666 36.003 42.961 37.194 47.750 41.738 44.239 34.052 31.731 54.661 30.928 47.847 31.286 38.813 40.166 32.905 42.057 49.834 47.556 37.729 22.120 40.822 41.104 62.399 32.550 43.558 11 The variance of the mileage data is, a 99.842 b 97.885 c 95.965 d 94.084