The table and scatter plot show the time spent watching TV, x, and the time spent doing homework, y, by each of 9 students last week. The equation of the line of best fit is y=-0.2x+19.62. Time spent watching TV, x (in hours) 6.10 6.60 8.20 10.50 10.50 12.00 13.50 16.60 18.10 Time spent watching TV (in hours) 12.00 Time spent doing homework, y (in hours) 19.60 16.38 21.13 15.63 18.94 13.00 13.40 16.57 17.50 18.10 Observed time spent doing homework (in hours) Time spent doing homework (in hours) 0 32 28- 24- 20- Use the equation of the line of best fit, and use the table above, to fill in the blanks below. Give exact answers, not rounded approximations. X Predicted time spent doing homework (in hours) 0 10 X 12 14 16 Time spent watching TV (in hours) Residual (in hours) 0 0 18 20 22
The table and scatter plot show the time spent watching TV, x, and the time spent doing homework, y, by each of 9 students last week. The equation of the line of best fit is y=-0.2x+19.62. Time spent watching TV, x (in hours) 6.10 6.60 8.20 10.50 10.50 12.00 13.50 16.60 18.10 Time spent watching TV (in hours) 12.00 Time spent doing homework, y (in hours) 19.60 16.38 21.13 15.63 18.94 13.00 13.40 16.57 17.50 18.10 Observed time spent doing homework (in hours) Time spent doing homework (in hours) 0 32 28- 24- 20- Use the equation of the line of best fit, and use the table above, to fill in the blanks below. Give exact answers, not rounded approximations. X Predicted time spent doing homework (in hours) 0 10 X 12 14 16 Time spent watching TV (in hours) Residual (in hours) 0 0 18 20 22

Holt Mcdougal Larson Pre-algebra: Student Edition 2012
1st Edition
ISBN:9780547587776
Author:HOLT MCDOUGAL
Publisher:HOLT MCDOUGAL
Chapter8: Linear Functions
Section8.5: Slope-intercept Form
Problem 9E

Related questions
Question
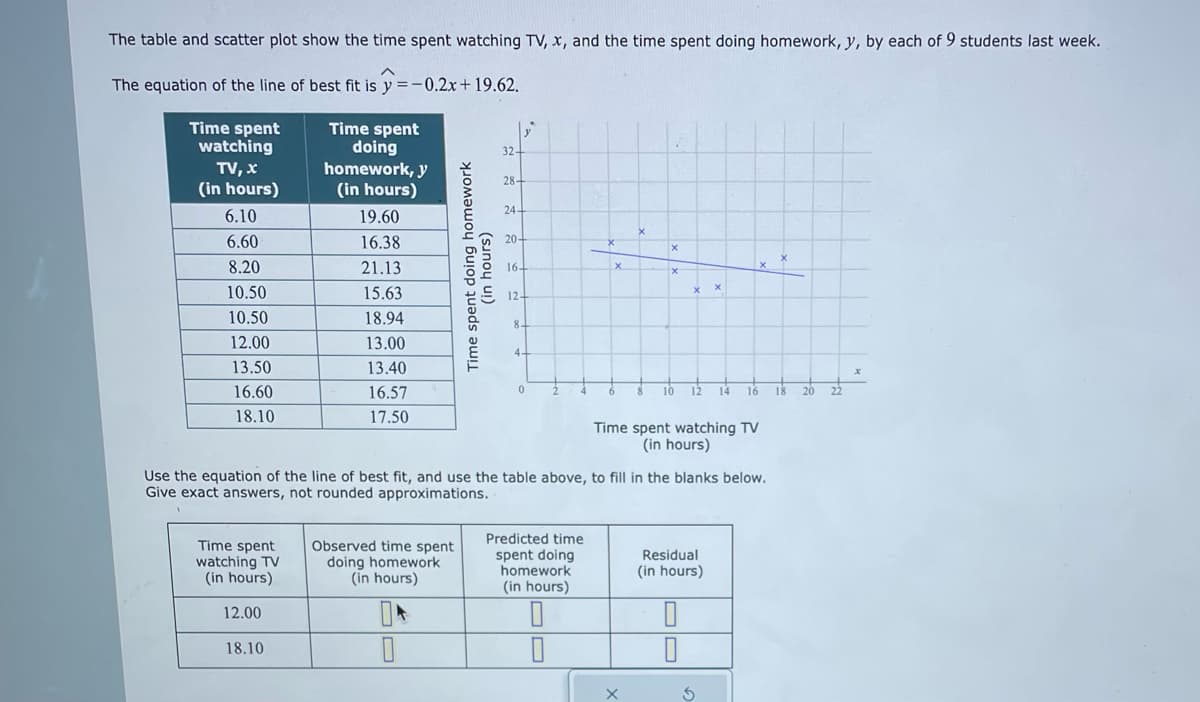
Transcribed Image Text:The table and scatter plot show the time spent watching TV, x, and the time spent doing homework, y, by each of 9 students last week.
The equation of the line of best fit is y=-0.2x + 19.62.
Time spent
watching
TV, x
(in hours)
6.10
6.60
8.20
10.50
10.50
12.00
13.50
16.60
18.10
Time spent
watching TV
(in hours)
Time spent
doing
homework, y
(in hours)
12.00
18.10
19.60
16.38
21.13
15.63
18.94
13.00
13.40
16.57
17.50
Observed time spent
doing homework
(in hours)
Time spent doing homework
(in hours)
0
32
28+
24-
20+
16-
12+
8.
4-
0
Predicted time
spent doing
homework
(in hours)
X
200
X
X
xx
Use the equation of the line of best fit, and use the table above, to fill in the blanks below.
Give exact answers, not rounded approximations..
X
X
12
0
0
Time spent watching TV
(in hours)
Residual
(in hours)
X
X
S
14 16
X
18
20
22
x
Expert Solution
This question has been solved!
Explore an expertly crafted, step-by-step solution for a thorough understanding of key concepts.

This is a popular solution!

Trending now
This is a popular solution!

Step by step
Solved in 4 steps with 4 images

Recommended textbooks for you
Holt Mcdougal Larson Pre-algebra: Student Edition…
Algebra
ISBN:
9780547587776
Author:
HOLT MCDOUGAL
Publisher:
HOLT MCDOUGAL

Glencoe Algebra 1, Student Edition, 9780079039897…
Algebra
ISBN:
9780079039897
Author:
Carter
Publisher:
McGraw Hill

College Algebra (MindTap Course List)
Algebra
ISBN:
9781305652231
Author:
R. David Gustafson, Jeff Hughes
Publisher:
Cengage Learning
Holt Mcdougal Larson Pre-algebra: Student Edition…
Algebra
ISBN:
9780547587776
Author:
HOLT MCDOUGAL
Publisher:
HOLT MCDOUGAL
Glencoe Algebra 1, Student Edition, 9780079039897…
Algebra
ISBN:
9780079039897
Author:
Carter
Publisher:
McGraw Hill
College Algebra (MindTap Course List)
Algebra
ISBN:
9781305652231
Author:
R. David Gustafson, Jeff Hughes
Publisher:
Cengage Learning

Linear Algebra: A Modern Introduction
Algebra
ISBN:
9781285463247
Author:
David Poole
Publisher:
Cengage Learning

Elementary Algebra
Algebra
ISBN:
9780998625713
Author:
Lynn Marecek, MaryAnne Anthony-Smith
Publisher:
OpenStax - Rice University
