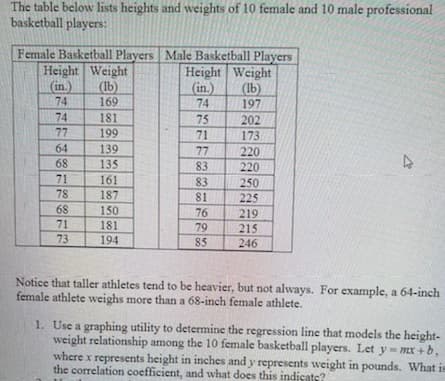
The table below lists heights and weights of 10 female and 10 male professional basketball players: Female Basketball Players Male Basketball Players Height Weight (in.) 74 Height Weight (in.) 74 (Ib) 169 (lb) 197 74 181 75 202 77 199 71 173 64 139 77 220 68 135 83 220 71 78 161 83 250 187 81 225 68 150 76 219 215 71 181 79 73 194 85 246 Notice that taller athletes tend to be heavier, but not always. For example, a 64-inch female athlete weighs more than a 68-inch female athlete. 1. Use a graphing utility to determine the regression line that models the height- weight relationship among the 10 female basketball players. Let y- mx +b, where x represents height in inches and y represents weight in pounds. What is the correlation coefficient, and what does this indicate?


Inverse Normal Distribution
The method used for finding the corresponding z-critical value in a normal distribution using the known probability is said to be an inverse normal distribution. The inverse normal distribution is a continuous probability distribution with a family of two parameters.
Mean, Median, Mode
It is a descriptive summary of a data set. It can be defined by using some of the measures. The central tendencies do not provide information regarding individual data from the dataset. However, they give a summary of the data set. The central tendency or measure of central tendency is a central or typical value for a probability distribution.
Z-Scores
A z-score is a unit of measurement used in statistics to describe the position of a raw score in terms of its distance from the mean, measured with reference to standard deviation from the mean. Z-scores are useful in statistics because they allow comparison between two scores that belong to different normal distributions.
I need the answer of the question according to data table attached. Thanks!


Trending now
This is a popular solution!

Step by step
Solved in 2 steps with 2 images


