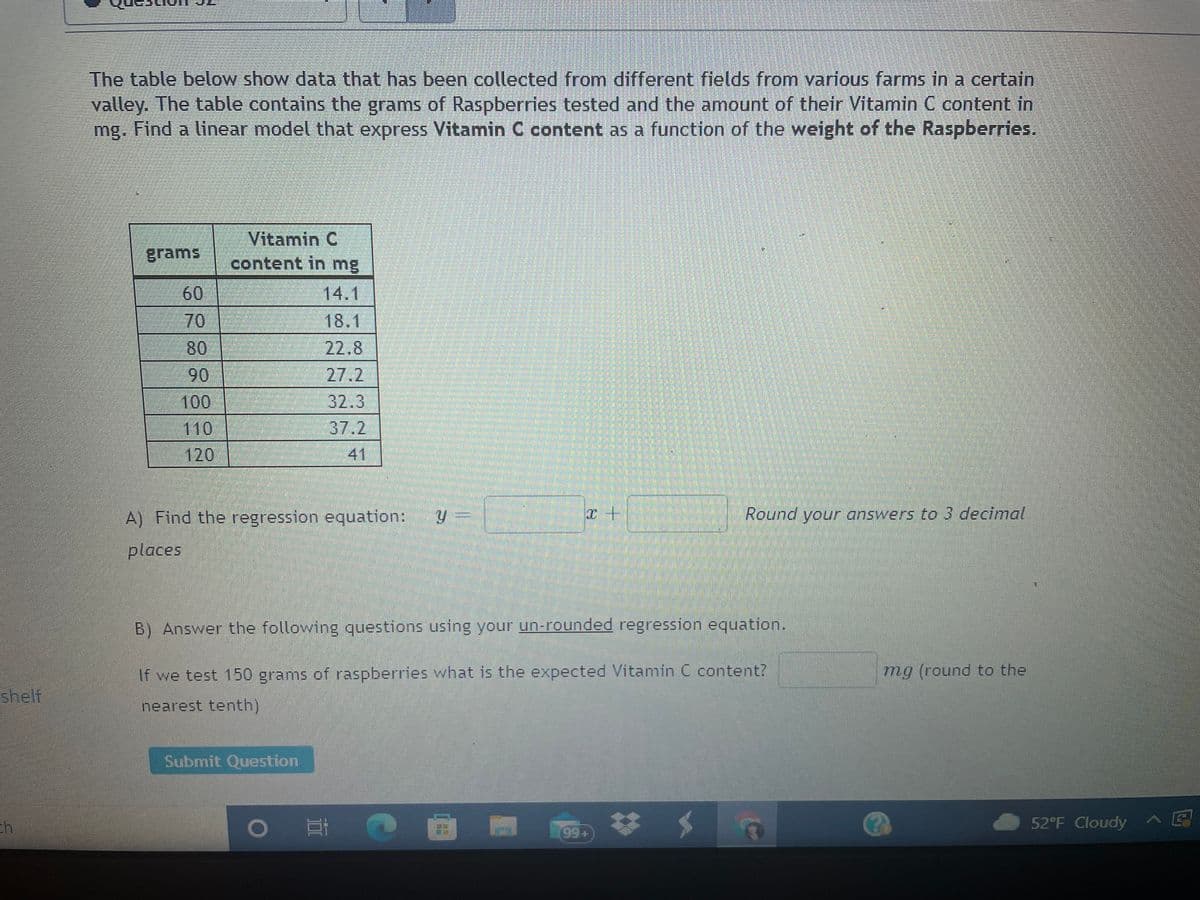
The table below show data that has been collected from different fields from various farms in a certain valley. The table contains the grams of Raspberries tested and the amount of their Vitamin C content in mg. Find a linear model that express Vitamin C content as a function of the weight of the Raspberries. Vitamin C grams content in mg 60 14.1 70 18.1 80 22.8 90 27.2 100 32.3 110 37.2 120 41 A) Find the regression equation: Round your answers to 3 decimal places B) Answer the following questions using your un-rounded regression equation. If we test 150 grams of raspberries what is the expected Vitamin C content? mg (round to the helf nearest tenth)
The table below show data that has been collected from different fields from various farms in a certain valley. The table contains the grams of Raspberries tested and the amount of their Vitamin C content in mg. Find a linear model that express Vitamin C content as a function of the weight of the Raspberries. Vitamin C grams content in mg 60 14.1 70 18.1 80 22.8 90 27.2 100 32.3 110 37.2 120 41 A) Find the regression equation: Round your answers to 3 decimal places B) Answer the following questions using your un-rounded regression equation. If we test 150 grams of raspberries what is the expected Vitamin C content? mg (round to the helf nearest tenth)

Algebra & Trigonometry with Analytic Geometry
13th Edition
ISBN:9781133382119
Author:Swokowski
Publisher:Swokowski
Chapter3: Functions And Graphs
Section3.3: Lines
Problem 76E

Related questions
Question
Transcribed Image Text:The table below show data that has been collected from different fields from various farms in a certain
valley. The table contains the grams of Raspberries tested and the amount of their Vitamin C content in
mg. Find a linear model that express Vitamin C content as a function of the weight of the Raspberries.
Vitamin C
content in mg
grams
60
70
14.1
18.1
80
90
100
22.8
27.2
32.3
110
37.2
120
41
A) Find the regression equation: Y
Round your answers to3 decimal
places
B) Answer the following questions using your un-rounded regression equation.
If we test 150 grams of raspberries what is the expected Vitamin C content?
mg (round to the
shelf
nearest tenth)
Submit Question
ch
52°F Cloudy ^
99+)
Expert Solution
This question has been solved!
Explore an expertly crafted, step-by-step solution for a thorough understanding of key concepts.

This is a popular solution!

Trending now
This is a popular solution!

Step by step
Solved in 2 steps

Recommended textbooks for you
Algebra & Trigonometry with Analytic Geometry
Algebra
ISBN:
9781133382119
Author:
Swokowski
Publisher:
Cengage

Algebra & Trigonometry with Analytic Geometry
Algebra
ISBN:
9781133382119
Author:
Swokowski
Publisher:
Cengage