The table below shows data on U.S. exports and imports of goods and services for five years. For each of these years, indicate whether the United States was running a trade surplus or deficit, and dollar amount of the surplus or deficit, and calculate the ratio as a percent of the s deficit to US. exports Instructions: In the event a deficit, do NOT include a negative sign (-) for either the dollar amount or the ratio (% of exports). Enter your responses rounded to one decimal place. U.S. Exports (billions of dollars) 457. U.S. Imports (billions of dollars) 642.0 Surplus or deficit Deficit Deficit Deficit Surplus Deficit Amount of surplus/deficit (billions of dollars) Surplus/ deficit as a percent of exports Year 1 667 2 531.2 592.7 7450 696.6 721.5 720.4 687.6
The table below shows data on U.S. exports and imports of goods and services for five years. For each of these years, indicate whether the United States was running a trade surplus or deficit, and dollar amount of the surplus or deficit, and calculate the ratio as a percent of the s deficit to US. exports Instructions: In the event a deficit, do NOT include a negative sign (-) for either the dollar amount or the ratio (% of exports). Enter your responses rounded to one decimal place. U.S. Exports (billions of dollars) 457. U.S. Imports (billions of dollars) 642.0 Surplus or deficit Deficit Deficit Deficit Surplus Deficit Amount of surplus/deficit (billions of dollars) Surplus/ deficit as a percent of exports Year 1 667 2 531.2 592.7 7450 696.6 721.5 720.4 687.6

Chapter4: The Aggregate Economy
Section: Chapter Questions
Problem 5E

Related questions
Question
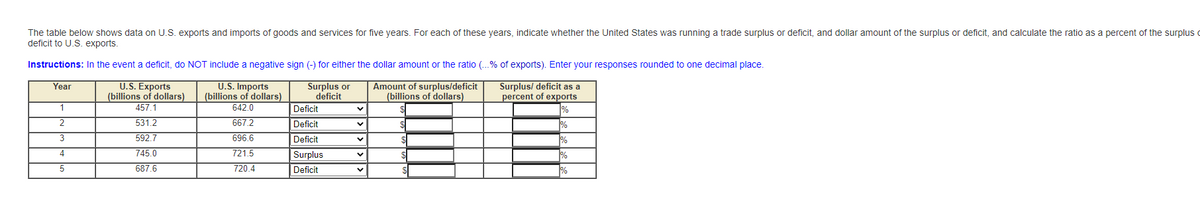
Transcribed Image Text:The table below shows data on U.S. exports and imports of goods and services for five years. For each of these years, indicate whether the United States was running a trade surplus or deficit, and dollar amount of the surplus or deficit, and calculate the ratio as a percent of the surplus
deficit to U.S. exports.
Instructions: In the event a deficit, do NOT include a negative sign (-) for either the dollar amount or the ratio (.% of exports). Enter your responses rounded to one decimal place.
U.S. Exports
(billions of dollars)
U.S. Imports
(billions of dollars)
Year
Surplus or
deficit
Amount of surplus/deficit
(billions of dollars)
Surplus/ deficit as a
percent of exports
1
457.1
642.0
Deficit
2
531.2
667.2
Deficit
%
3
592.7
696.6
Deficit
4
745.0
721.5
Surplus
%
687.6
720.4
Deficit
%
Expert Solution
This question has been solved!
Explore an expertly crafted, step-by-step solution for a thorough understanding of key concepts.

This is a popular solution!

Trending now
This is a popular solution!

Step by step
Solved in 2 steps

Knowledge Booster


Learn more about
Need a deep-dive on the concept behind this application? Look no further. Learn more about this topic, economics and related others by exploring similar questions and additional content below.Recommended textbooks for you