The table below shows the frequency distribution for the ages of women who became mothers during one year. a. Obtain a relative-frequency histogram of these age data. Choose the correct graph below. A. Age (yrs) Frequency 50,344 425,311 1,020,058 1,060,821 951,908 453,991 95,708 54,827 0,3- 10-under 15 15-under 20 20-under 25 012.5 22.5 32.5 42.5 25-under30 30-under 35 OB. 35-under 40 0,3- 40-under 45 45-under 50 12.5 22.5 32.5 42.5 Oc. 0.3- 12.5 22.5 32.5 42.5 b. Based on your histogram, do you think that the ages of women who became mothers that year are approximately normally distributed? Yes No Rel. Freq. Rel. Freg.
The table below shows the frequency distribution for the ages of women who became mothers during one year. a. Obtain a relative-frequency histogram of these age data. Choose the correct graph below. A. Age (yrs) Frequency 50,344 425,311 1,020,058 1,060,821 951,908 453,991 95,708 54,827 0,3- 10-under 15 15-under 20 20-under 25 012.5 22.5 32.5 42.5 25-under30 30-under 35 OB. 35-under 40 0,3- 40-under 45 45-under 50 12.5 22.5 32.5 42.5 Oc. 0.3- 12.5 22.5 32.5 42.5 b. Based on your histogram, do you think that the ages of women who became mothers that year are approximately normally distributed? Yes No Rel. Freq. Rel. Freg.

Glencoe Algebra 1, Student Edition, 9780079039897, 0079039898, 2018
18th Edition
ISBN:9780079039897
Author:Carter
Publisher:Carter
Chapter10: Statistics
Section10.6: Summarizing Categorical Data
Problem 4BGP

Related questions
Topic Video
Question
please help me
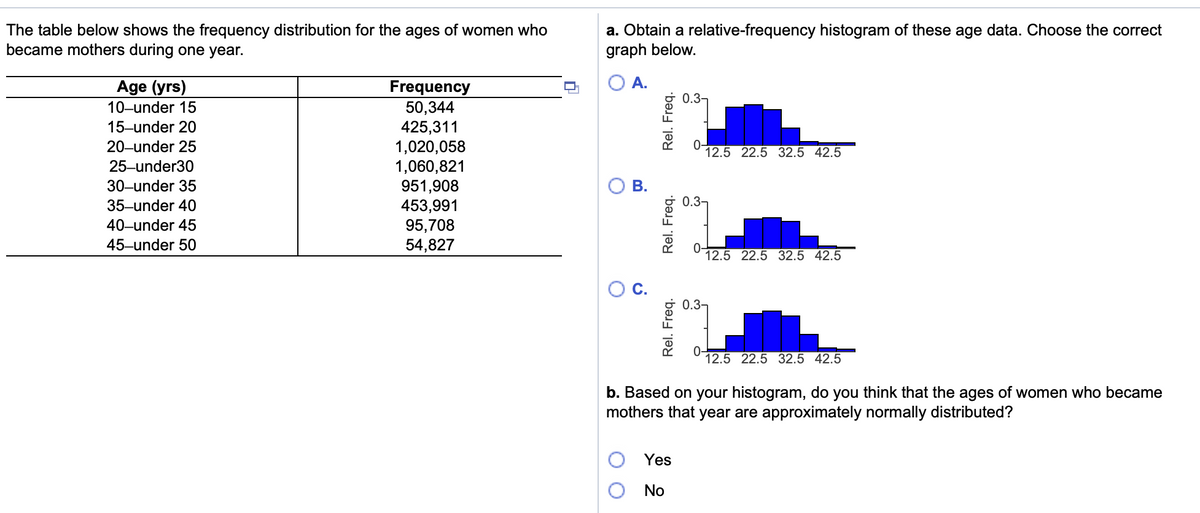
Transcribed Image Text:The table below shows the frequency distribution for the ages of women who
became mothers during one year.
a. Obtain a relative-frequency histogram of these age data. Choose the correct
graph below.
Age (yrs)
A.
Frequency
50,344
425,311
1,020,058
1,060,821
951,908
453,991
95,708
54,827
0.3-
10-under 15
15-under 20
20-under 25
0-
12.5 22.5 32.5 42.5
25-under30
30-under 35
В.
35-under 40
0.3-
40-under 45
45-under 50
0-
12.5 22.5 32.5 42.5
C.
0.3-
12.5 22.5 32.5 42.5
b. Based on your histogram, do you think that the ages of women who became
mothers that year are approximately normally distributed?
Yes
No
Rel. Freq.
Rel. Freq.
Rel. Freq.
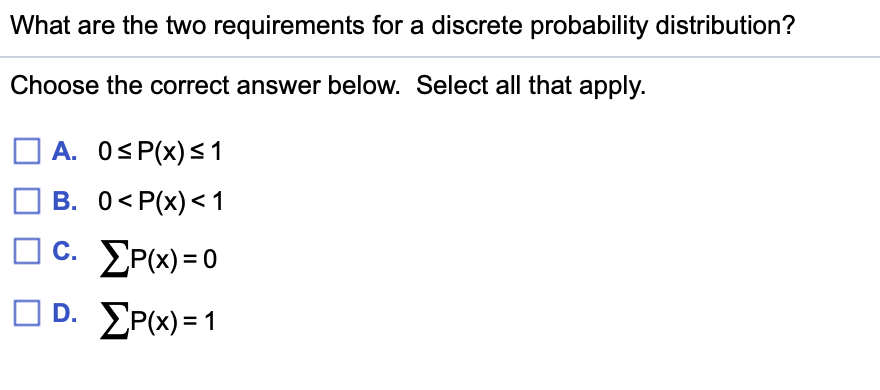
Transcribed Image Text:What are the two requirements for a discrete probability distribution?
Choose the correct answer below. Select all that apply.
A. OS P(x)<1
В. О<Р(х)<1
c. EP(x) = 0
O D. EP(x) = 1
Expert Solution
This question has been solved!
Explore an expertly crafted, step-by-step solution for a thorough understanding of key concepts.

This is a popular solution!

Trending now
This is a popular solution!

Step by step
Solved in 2 steps

Knowledge Booster


Learn more about
Need a deep-dive on the concept behind this application? Look no further. Learn more about this topic, statistics and related others by exploring similar questions and additional content below.Recommended textbooks for you
Glencoe Algebra 1, Student Edition, 9780079039897…
Algebra
ISBN:
9780079039897
Author:
Carter
Publisher:
McGraw Hill
Glencoe Algebra 1, Student Edition, 9780079039897…
Algebra
ISBN:
9780079039897
Author:
Carter
Publisher:
McGraw Hill