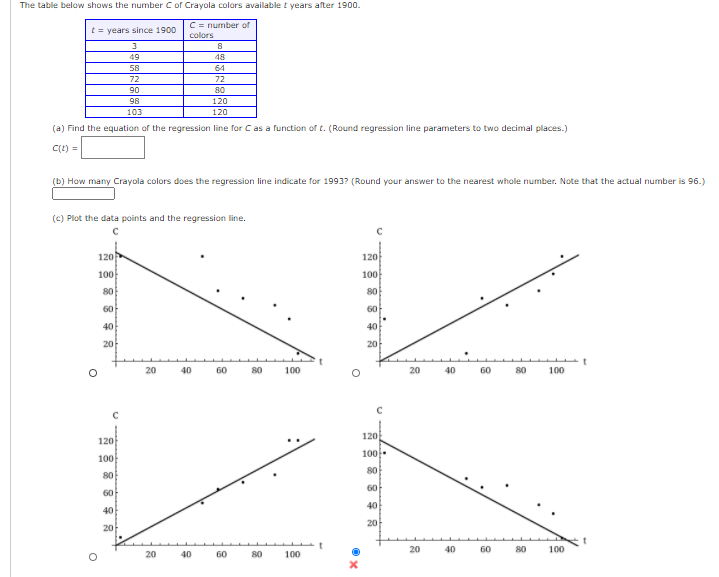
The table below shows the number Cof Crayola colors available t years alter 1900. C= number of t= years since 1900 colors 49 48 58 72 64 72 80 120 90 98 103 120 (a) Find the equation of the regression line for C as a function of t. (Round regression line parameters to two decimal places.) C(t) = (b) How many Crayola colors does the regression line indicate for 1993? (Round your answer to the nearest whole number. Note that the actual number is 96. (e) Plot the data points and the regression line. 120 120 100 100 80 80 60 60 40 40 20 20 20 40 80 100 20 40 60 100 120 120 100 100 80 80 60 60 40 40 20 20 20 40 60 80 100 20 40 60 80 100

Functions and Change: A Modeling Approach to College Algebra (MindTap Course List)
6th Edition
ISBN:9781337111348
Author:Bruce Crauder, Benny Evans, Alan Noell
Publisher:Bruce Crauder, Benny Evans, Alan Noell
Chapter5: A Survey Of Other Common Functions
Section5.6: Higher-degree Polynomials And Rational Functions
Problem 1TU: The following fictitious table shows kryptonite price, in dollar per gram, t years after 2006. t=...
icon
Related questions
icon
Concept explainers
Question
The table below shows the number C of Crayola colors available t years after 1900.
C = number of
t = years since 1900
colors
3.
49
48
58
64
72
72
90
80
98
120
103
120
(a) Find the equation of the regression line for C as a function of t. (Round regression line parameters to two decimal places.)
C(t) =
(b) How many Crayola colors does the regression line indicate for 1993? (Round your answer to the nearest whole number. Note that the actual number is 96.)
(c) Plot the data points and the regression line.
120
120
100
100
80
80
60
60
40
40
20
20
20
40
60
80
100
20
40
60
80
100
120
120
100
100
80
80
6아
60
40
40
20
20
20
40
60
80
100
20
40
60
80
100
8 우 유
Transcribed Image Text:The table below shows the number C of Crayola colors available t years after 1900. C = number of t = years since 1900 colors 3. 49 48 58 64 72 72 90 80 98 120 103 120 (a) Find the equation of the regression line for C as a function of t. (Round regression line parameters to two decimal places.) C(t) = (b) How many Crayola colors does the regression line indicate for 1993? (Round your answer to the nearest whole number. Note that the actual number is 96.) (c) Plot the data points and the regression line. 120 120 100 100 80 80 60 60 40 40 20 20 20 40 60 80 100 20 40 60 80 100 120 120 100 100 80 80 6아 60 40 40 20 20 20 40 60 80 100 20 40 60 80 100 8 우 유
Expert Solution
steps

Step by step

Solved in 4 steps with 3 images

Blurred answer
Knowledge Booster
Correlation, Regression, and Association
Learn more about
Need a deep-dive on the concept behind this application? Look no further. Learn more about this topic, statistics and related others by exploring similar questions and additional content below.
Similar questions
  • SEE MORE QUESTIONS
Recommended textbooks for you
Functions and Change: A Modeling Approach to Coll…
Algebra
ISBN:
9781337111348
Author:
Bruce Crauder, Benny Evans, Alan Noell
Publisher:
Cengage Learning
Algebra & Trigonometry with Analytic Geometry
Algebra
ISBN:
9781133382119
Author:
Swokowski
Publisher:
Cengage
College Algebra
College Algebra
Algebra
ISBN:
9781305115545
Author:
James Stewart, Lothar Redlin, Saleem Watson
Publisher:
Cengage Learning
Linear Algebra: A Modern Introduction
Algebra
ISBN:
9781285463247
Author:
David Poole
Publisher:
Cengage Learning