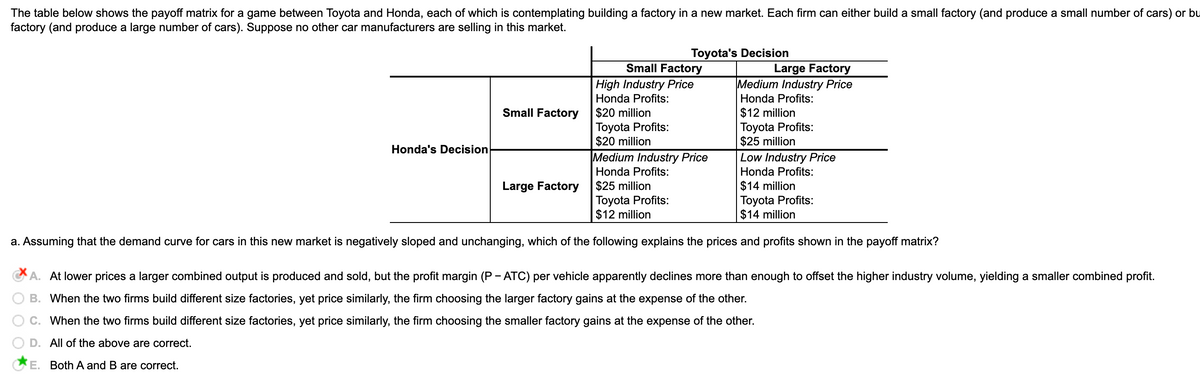
The table below shows the payoff matrix for a game between Toyota and Honda, each of which is contemplating building a factory in a new market. Each firm can either build a small factory (and produce a small number of cars) or bu factory (and produce a large number of cars). Suppose no other car manufacturers are selling in this market. Toyota's Decision Small Factory High Industry Price Honda Profits: $20 million Toyota Profits: $20 million Medium Industry Price Large Factory Medium Industry Price Honda Profits: $12 million Toyota Profits: $25 million Low Industry Price Honda Profits: $14 million Toyota Profits: $14 million Small Factory Honda's Decision Honda Profits: $25 million Toyota Profits: $12 million Large Factory a. Assuming that the demand curve for cars in this new market is negatively sloped and unchanging, which of the following explains the prices and profits shown in the payoff matrix? A. At lower prices a larger combined output is produced and sold, but the profit margin (P - ATC) per vehicle apparently declines more than enough to offset the higher industry volume, yielding a smaller combined profit. O B. When the two firms build different size factories, yet price similarly, the firm choosing the larger factory gains at the expense of the other. O C. When the two firms build different size factories, yet price similarly, the firm choosing the smaller factory gains at the expense of the other. O D. All of the above are correct. *E. Both A and B are correct.
The table below shows the payoff matrix for a game between Toyota and Honda, each of which is contemplating building a factory in a new market. Each firm can either build a small factory (and produce a small number of cars) or bu factory (and produce a large number of cars). Suppose no other car manufacturers are selling in this market. Toyota's Decision Small Factory High Industry Price Honda Profits: $20 million Toyota Profits: $20 million Medium Industry Price Large Factory Medium Industry Price Honda Profits: $12 million Toyota Profits: $25 million Low Industry Price Honda Profits: $14 million Toyota Profits: $14 million Small Factory Honda's Decision Honda Profits: $25 million Toyota Profits: $12 million Large Factory a. Assuming that the demand curve for cars in this new market is negatively sloped and unchanging, which of the following explains the prices and profits shown in the payoff matrix? A. At lower prices a larger combined output is produced and sold, but the profit margin (P - ATC) per vehicle apparently declines more than enough to offset the higher industry volume, yielding a smaller combined profit. O B. When the two firms build different size factories, yet price similarly, the firm choosing the larger factory gains at the expense of the other. O C. When the two firms build different size factories, yet price similarly, the firm choosing the smaller factory gains at the expense of the other. O D. All of the above are correct. *E. Both A and B are correct.

Microeconomics A Contemporary Intro
10th Edition
ISBN:9781285635101
Author:MCEACHERN
Publisher:MCEACHERN
Chapter10: Monopolistic Competition And Oligopoly
Section: Chapter Questions
Problem 13PAE

Related questions
Question
Why E is correct?
Transcribed Image Text:The table below shows the payoff matrix for a game between Toyota and Honda, each of which is contemplating building a factory in a new market. Each firm can either build a small factory (and produce a small number of cars) or bu
factory (and produce a large number of cars). Suppose no other car manufacturers are selling in this market.
Toyota's Decision
Large Factory
Medium Industry Price
Honda Profits:
Small Factory
High Industry Price
Honda Profits:
Small Factory
$20 million
Toyota Profits:
$20 million
Medium Industry Price
$12 million
Toyota Profits:
$25 million
Honda's Decision
Low Industry Price
Honda Profits:
Honda Profits:
$25 million
Toyota Profits:
$12 million
$14 million
Toyota Profits:
$14 million
Large Factory
a. Assuming that the demand curve for cars in this new market is negatively sloped and unchanging, which of the following explains the prices and profits shown in the payoff matrix?
A. At lower prices a larger combined output is produced and sold, but the profit margin (P - ATC) per vehicle apparently declines more than enough to offset the higher industry volume, yielding a smaller combined profit.
B. When the two firms build different size factories, yet price similarly, the firm choosing the larger factory gains at the expense of the other.
C. When the two firms build different size factories, yet price similarly, the firm choosing the smaller factory gains at the expense of the other.
D. All of the above are correct.
E. Both A and B are correct.
Expert Solution
This question has been solved!
Explore an expertly crafted, step-by-step solution for a thorough understanding of key concepts.

This is a popular solution!

Trending now
This is a popular solution!

Step by step
Solved in 5 steps

Knowledge Booster


Learn more about
Need a deep-dive on the concept behind this application? Look no further. Learn more about this topic, economics and related others by exploring similar questions and additional content below.Recommended textbooks for you


Managerial Economics: A Problem Solving Approach
Economics
ISBN:
9781337106665
Author:
Luke M. Froeb, Brian T. McCann, Michael R. Ward, Mike Shor
Publisher:
Cengage Learning
Managerial Economics: A Problem Solving Approach
Economics
ISBN:
9781337106665
Author:
Luke M. Froeb, Brian T. McCann, Michael R. Ward, Mike Shor
Publisher:
Cengage Learning

Exploring Economics
Economics
ISBN:
9781544336329
Author:
Robert L. Sexton
Publisher:
SAGE Publications, Inc

Managerial Economics: Applications, Strategies an…
Economics
ISBN:
9781305506381
Author:
James R. McGuigan, R. Charles Moyer, Frederick H.deB. Harris
Publisher:
Cengage Learning