The table below summarizes data from a survey of a sample of women. Using a 0.05 significance level, and assuming that the sample sizes of 700 men and 400 women are predetermined, test the claim that the proportions of agree/disagree responses are the same for subjects interviewed by men and the subjects interviewed by women. Does it appear that the gender of the interviewer affected the responses of women? Gender of Interviewer Man Woman Women who agree 458 345 Women who disagree 242 55 To view the chi-square distribution table, see image below. Identify the null and alternative hypotheses. Choose the correct answer below. A. H0: The proportions of agree/disagree responses are different for the subjects interviewed by men and the subjects interviewed by women. H1: The proportions are the same. B. H0: The proportions of agree/disagree responses are the same for the subjects interviewed by men and the subjects interviewed by women. H1: The proportions are different. C. H0: The response of the subject and the gender of the subject are independent. H1: The response of the subject and the gender of the subject are dependent. -Compute the test statistic (round to 5 decimal places) -Find the critical value(s) use commas to seperate answers if needed. -What is the conclusion based on the hypothesis test. (fail to reject or reject H0) (sufficent or insufficent evidence to warrent the rejection of the claim that the proptions agree or disagree responces are the same for the subjects that interviewed by men and the subjects interviewed by women. does the gender of the intervier affect the responses of women?
The table below summarizes data from a survey of a sample of women. Using a 0.05 significance level, and assuming that the sample sizes of 700 men and 400 women are predetermined, test the claim that the proportions of agree/disagree responses are the same for subjects interviewed by men and the subjects interviewed by women. Does it appear that the gender of the interviewer affected the responses of women? Gender of Interviewer Man Woman Women who agree 458 345 Women who disagree 242 55 To view the chi-square distribution table, see image below. Identify the null and alternative hypotheses. Choose the correct answer below. A. H0: The proportions of agree/disagree responses are different for the subjects interviewed by men and the subjects interviewed by women. H1: The proportions are the same. B. H0: The proportions of agree/disagree responses are the same for the subjects interviewed by men and the subjects interviewed by women. H1: The proportions are different. C. H0: The response of the subject and the gender of the subject are independent. H1: The response of the subject and the gender of the subject are dependent. -Compute the test statistic (round to 5 decimal places) -Find the critical value(s) use commas to seperate answers if needed. -What is the conclusion based on the hypothesis test. (fail to reject or reject H0) (sufficent or insufficent evidence to warrent the rejection of the claim that the proptions agree or disagree responces are the same for the subjects that interviewed by men and the subjects interviewed by women. does the gender of the intervier affect the responses of women?

Algebra & Trigonometry with Analytic Geometry
13th Edition
ISBN:9781133382119
Author:Swokowski
Publisher:Swokowski
Chapter10: Sequences, Series, And Probability
Section10.8: Probability
Problem 10E

Related questions

Topic Video
Question
The table below summarizes data from a survey of a sample of women. Using a
0.05
significance level, and assuming that the sample sizes of
700
men and
400
women are predetermined, test the claim that the proportions of agree/disagree responses are the same for subjects interviewed by men and the subjects interviewed by women. Does it appear that the gender of the interviewer affected the responses of women?|
|
|
|
|
|
|
|
|
|
Gender of Interviewer
|
|
|
|
|---|---|---|---|---|---|
|
|
|
Man
|
Woman
|
|
|
|
Women who agree
|
|
458
|
345
|
|
|
|
Women who disagree
|
|
242
|
55
|
|
|
To view the chi-square distribution table, see image below.
Identify the null and alternative hypotheses. Choose the correct answer below.
H0:
The proportions of agree/disagree responses are different for the subjects interviewed by men and the subjects interviewed by women.H1:
The proportions are the same.H0:
The proportions of agree/disagree responses are the same for the subjects interviewed by men and the subjects interviewed by women.H1:
The proportions are different.H0:
The response of the subject and the gender of the subject are independent.H1:
The response of the subject and the gender of the subject are dependent.-Compute the test statistic (round to 5 decimal places)
-Find the critical value(s) use commas to seperate answers if needed.
-What is the conclusion based on the hypothesis test. (fail to reject or reject H0) (sufficent or insufficent evidence to warrent the rejection of the claim that the proptions agree or disagree responces are the same for the subjects that interviewed by men and the subjects interviewed by women. does the gender of the intervier affect the responses of women?
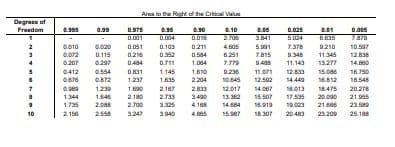
Transcribed Image Text:Area to be foght of the Crtical Va
Degrees of
Freedom
0.995
0.99
6.35
0.30
0.10
0.05
0.025
0.01
0.005
O001
2
0.010
0.020
0.051
0.103
0211
4.605
9210
10.597
5991
0.072
0115
0216
0.584
在51
7.815
11.345
12 838
0.207
0297
0484
1.084
0.488
11.143
13.277
14.00
0.554
1.810
9.236
11.071
12833
15.086
16.750
18.548
0412
1.145
0.872
1.237
2204
10.645
12.502
14.440
16.812
1.23
1.690
2167
2833
3490
12.017
13.32
14.684
14.067
16.013
18475
20.278
1.344
1.846
2180
2733
15.507
17.535
20.090
21.955
1.735
2.088
2700
3.325
4.168
16.919
19.023
21.808
10
2158
2558
3247
3940
15.987
18.307
20.483
23.209 25.188
Expert Solution
This question has been solved!
Explore an expertly crafted, step-by-step solution for a thorough understanding of key concepts.

This is a popular solution!

Trending now
This is a popular solution!

Step by step
Solved in 2 steps with 2 images

Knowledge Booster


Learn more about
Need a deep-dive on the concept behind this application? Look no further. Learn more about this topic, statistics and related others by exploring similar questions and additional content below.Recommended textbooks for you
Algebra & Trigonometry with Analytic Geometry
Algebra
ISBN:
9781133382119
Author:
Swokowski
Publisher:
Cengage
Algebra & Trigonometry with Analytic Geometry
Algebra
ISBN:
9781133382119
Author:
Swokowski
Publisher:
Cengage