The table gives the population in a small coastal community for the period 1997 2006. Figures shown are for January 1 each year. Year Population 1997 624 1998 856 1999 1,336 2000 1,578 2001 1,591 2002 1,483 2003 994 2004 826 2005 801 2006 745 (a) What was the average rate of change of population between 1997 and 1999?
The table gives the population in a small coastal community for the period 1997 2006. Figures shown are for January 1 each year. Year Population 1997 624 1998 856 1999 1,336 2000 1,578 2001 1,591 2002 1,483 2003 994 2004 826 2005 801 2006 745 (a) What was the average rate of change of population between 1997 and 1999?

Chapter3: Functions
Section3.3: Rates Of Change And Behavior Of Graphs
Problem 27SE: Table 4 gives the population of a town (in thousand) from 2000 to 2008. What was the average rate of...

Related questions
Question
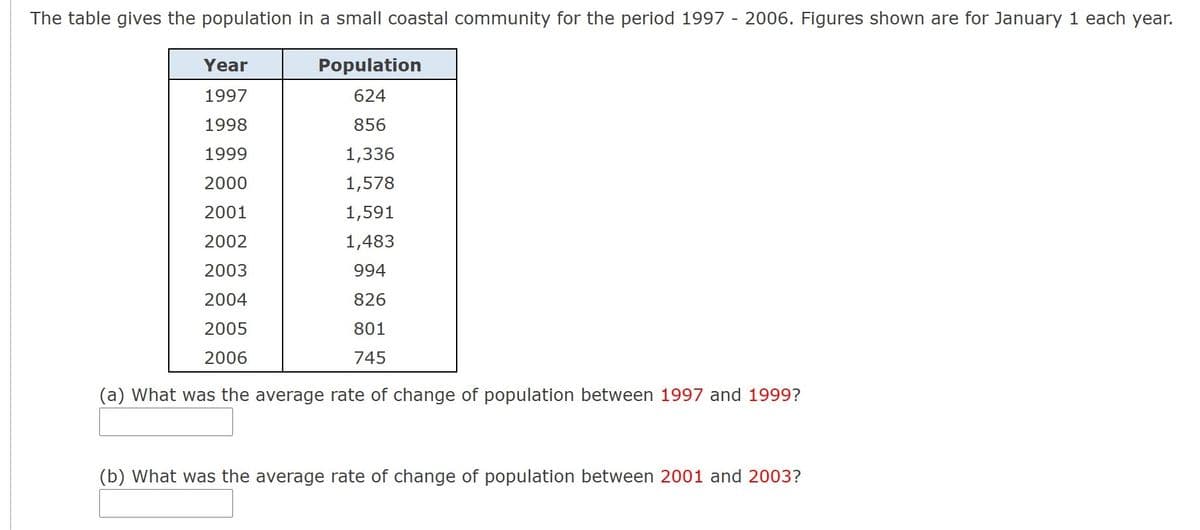
Transcribed Image Text:The table gives the population in a small coastal community for the period 1997 - 2006. Figures shown are for January 1 each year.
Year
Population
1997
624
1998
856
1999
1,336
2000
1,578
2001
1,591
2002
1,483
2003
994
2004
826
2005
801
2006
745
(a) What was the average rate of change of population between 1997 and 1999?
(b) What was the average rate of change of population between 2001 and 2003?
Expert Solution
This question has been solved!
Explore an expertly crafted, step-by-step solution for a thorough understanding of key concepts.

This is a popular solution!

Trending now
This is a popular solution!

Step by step
Solved in 4 steps with 14 images

Recommended textbooks for you

Functions and Change: A Modeling Approach to Coll…
Algebra
ISBN:
9781337111348
Author:
Bruce Crauder, Benny Evans, Alan Noell
Publisher:
Cengage Learning

Functions and Change: A Modeling Approach to Coll…
Algebra
ISBN:
9781337111348
Author:
Bruce Crauder, Benny Evans, Alan Noell
Publisher:
Cengage Learning

Glencoe Algebra 1, Student Edition, 9780079039897…
Algebra
ISBN:
9780079039897
Author:
Carter
Publisher:
McGraw Hill

Linear Algebra: A Modern Introduction
Algebra
ISBN:
9781285463247
Author:
David Poole
Publisher:
Cengage Learning