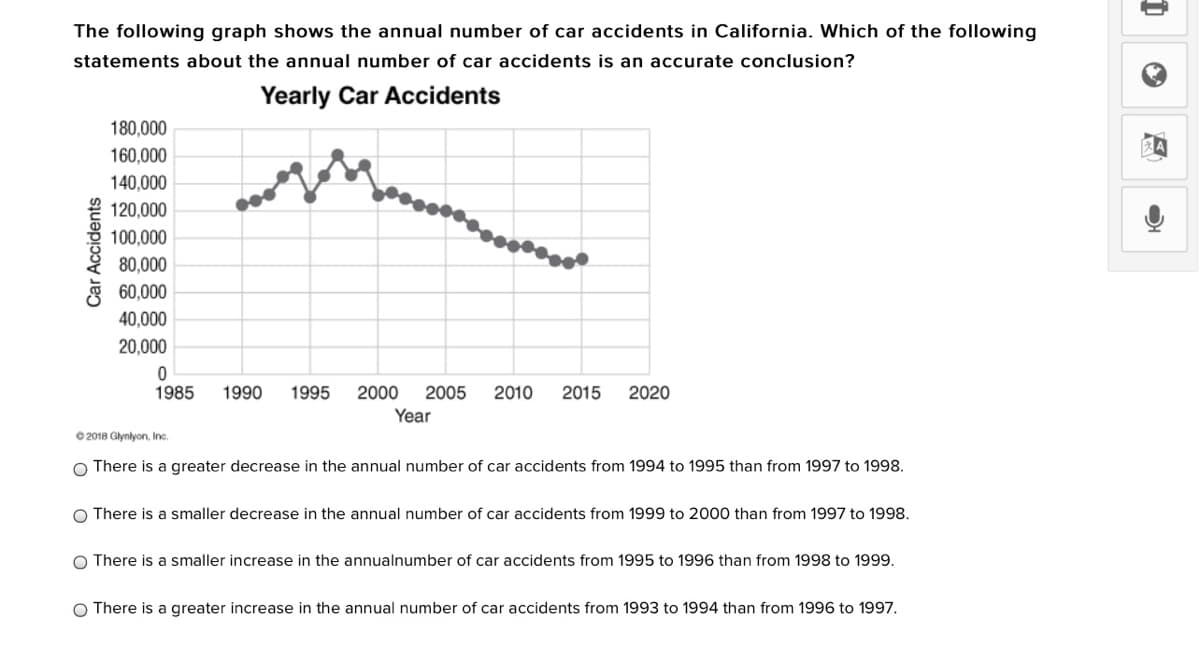
The following graph shows the annual number of car accidents in California. Which of the following statements about the annual number of car accidents is an accurate conclusion? Yearly Car Accidents 180,000 160,000 140,000 120,000 100,000 80,000 60,000 40,000 20,000 1985 1990 1995 2000 2005 2010 2015 2020 Year e 2018 Glynlyon. Inc. O There is a greater decrease in the annual number of car accidents from 1994 to 1995 than from 1997 to 1998. O There is a smaller decrease in the annual number of car accidents from 1999 to 2000 than from 1997 to 1998. O There is a smaller increase in the annualnumber of car accidents from 1995 to 1996 than from 1998 to 1999. O There is a greater increase in the annual number of car accidents from 1993 to 1994 than from 1996 to 1997. Car Accidents


Inverse Normal Distribution
The method used for finding the corresponding z-critical value in a normal distribution using the known probability is said to be an inverse normal distribution. The inverse normal distribution is a continuous probability distribution with a family of two parameters.
Mean, Median, Mode
It is a descriptive summary of a data set. It can be defined by using some of the measures. The central tendencies do not provide information regarding individual data from the dataset. However, they give a summary of the data set. The central tendency or measure of central tendency is a central or typical value for a probability distribution.
Z-Scores
A z-score is a unit of measurement used in statistics to describe the position of a raw score in terms of its distance from the mean, measured with reference to standard deviation from the mean. Z-scores are useful in statistics because they allow comparison between two scores that belong to different normal distributions.


Trending now
This is a popular solution!

Step by step
Solved in 6 steps with 2 images


