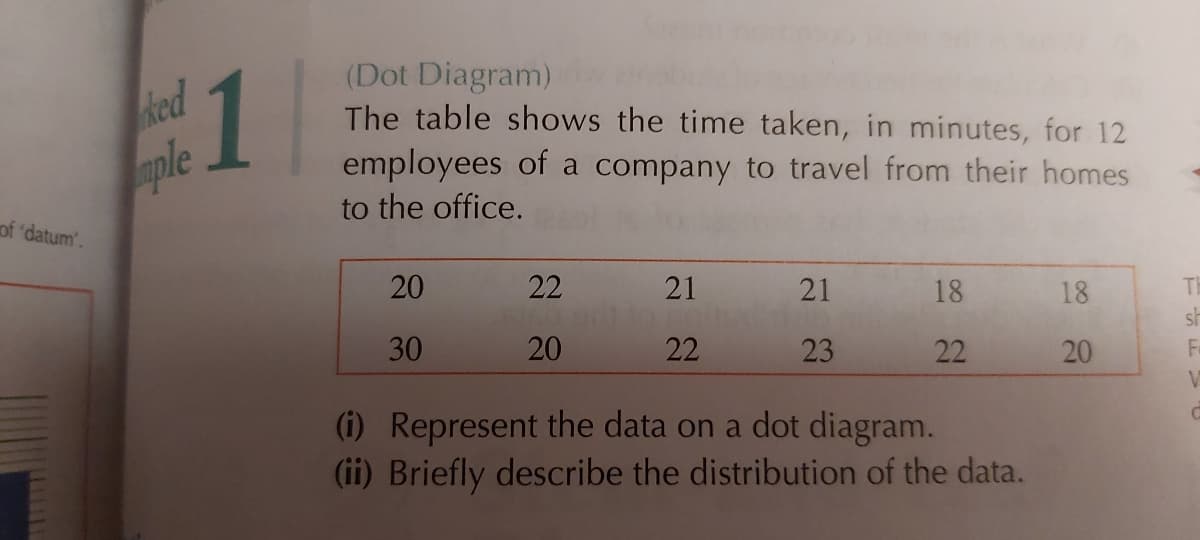
The table shows the time taken, in minutes, for 12 employees of a company to travel from their homes to the office. 20 22 21 21 18 18 30 20 22 23 22 20 (i) Represent the data on a dot diagram. ( Briefly describe the distribution of the data


Q: Exhibit 1 Stem-and-leaf of Data: Amount of Money earned in a day in dollars Leaf Unit = 10 N = * 2…
A: Since you have posted a question with multiple sub-parts, we will solve first three subparts for…
Q: This data represent the age distribution of a sample of 100 people covered by health insurar…
A: data: Age ( classes) number (f) 25-34 23 35-44 29 45-54 28 55-64 20
Q: A high school has 32 players on the football team. The summary of the players' weights is given in…
A: Box plot: Box plot is useful to compare the data graphically and it is most appropriate method to…
Q: Exhibit 1 Stem-and-leaf of Data: Amount of Money earned in a day in dollars Leaf Unit = 10 N = 2 59…
A: If the skewness is between -0.5 and 0.5, the data are fairly symmetrical. If the skewness is between…
Q: Exhibit 1 Stem-and-leaf of Data: Amount of Money earned in a day in dollars Leaf Unit 10 N = 59 3…
A: Note: Since you have posted a question with multiple sub-parts, we will solve first three sub-parts…
Q: The following table presents the scores of students in Statistics examination Scores Frequency 30-39…
A: Solution Mode of the data lies between the 70 -79 because this class has highest frequency.
Q: 3) (20) For the dataset below, do a complete box-and-line plot analysis. 3 15 18 19 23 23 26 27 28…
A: Given data: n=11 Q1=14×(n+1)th term=14×12=3rd term=18 Quartile 1 is 18 Q2=12×(n+1)th…
Q: The following data the time served (in months) by 33 prison inmates who were released recently. 33 3…
A: We want to find the stem and leaf plot and shape of the distribution.
Q: 4. Generate a data set of 9 values in increasing order that lead to the box and whisker plot below.…
A: According to the data
Q: A dietitian is comparing the sodium content in real cheese with the sodium content in imitation…
A: Introduction: The boxplots for the distribution of sodium content (milligrams) in random samples of…
Q: Exhibit 1 Stem-and-leaf of Data: Amount of Money earned in a day in dollars Leaf Unit 10 N = * 2 59…
A: TO create Box-Whisker plot we find five- number summary. Min, Q1, Q2,Q3 and Max. We can calculate…
Q: The ages in years of 21 people in a swimming pool are displayed in the stem-and-leaf plot. Determine…
A:
Q: 2. Sketch a histogram showing the distribution of scores shown in the following table: f 45-49 4…
A:
Q: The demand for bottled water increases during the hurricane season in Florida. The number of…
A: Measures of Central Tendency: A measure of central tendency represents the central value or typical…
Q: The following data compare a child's age with the number of gymnastic activities child is able to…
A: Hello! As you have posted more than 3 sub parts, we are answering the first 3 sub-parts. In case…
Q: The following table shows the distribution of daily profits made by a local supermarket over a…
A: i) One disadvantage of displaying data in groups is that it becomes difficult to read and understand…
Q: The following data represent the number of grams of fat in breakfast meals offered at a local fast…
A: a. Stem-and-leaf plot: A graphical representation of the quantitative data in which each data entry…
Q: The following data represent the number of grams of fat in breakfast meals offere plot and (b)…
A: Solution a. Stem-and-leaf plot: A graphical representation of the quantitative data in which each…
Q: Use a table of z-scores and percentiles to find the percentage of data items in a normal…
A:
Q: The table displays the scores of students on a recent exam. Find the mean of the scores to the…
A: Topic-mean
Q: The table represents the number of minutes of commercials during hour- long TV shows. Find the…
A: Given that Table for no. of minutes of commercials during hour long TV shows. No. of mins 12 13.5…
Q: The data represent the time, in minutes, spent reading a political blog in a day. Construct a…
A: Given the data which represents the time in minutes spent reading a political blog. Given that…
Q: An insurance company keeps a record of insurance plans sold per day for the past 150 days, as…
A: Solution: x =Number of Insurance plans sold per day f= Frequency of occurance x (f) x2 fx fx2…
Q: At the U.S. Open Tennis Championship a statistician keeps track of every serve that a player hits…
A: In statistics normally of the data can be check using the curve. If the data is normally…
Q: The scores from 50 psychology students that took a standardized test are summarized in the given…
A:
Q: Exhibit 1 Stem-and-leaf of Data: Amount of Money earned in a day in dollars Leaf Unit = 10 N = * 2…
A: Median= Q2 (second quartile) (iv) Q1=(n+1)th term/4 Here n=(34+1)/4th term 9th term Q1=37…
Q: Boys Distribution Girls Distribution 19 32 31 24 23 29 12 21 26 27 13 34 14 38 18 36 18 31 32 12…
A:
Q: The following table shows the distribution of daily profits made by a local supermarket over a…
A: Part (i): In a grouped frequency distribution one cannot see the exact values as the data is given…
Q: Measure the significance of the difference in the height of Chris's friend before and now with a…
A:
Q: A researcher studying mouse behaviour recorded the time (in seconds) it took 15 different mice to…
A: In every statistical analysis, before moving to any inferential statistics we do descriptive…
Q: The scores from 50 psychology students that took a standardized test are summarized in the given…
A: Frequency Distribution: In Statistical theory, a frequency distribution is a tabular, listed or…
Q: Exhibit 1 Stem-and-leaf of Data: Amount of Money earned in a day in dollars Leaf Unit = 10 N = * 59…
A: Before we answer b) (iv) and (v) let us convert the stem and leaf plot to original data. If we look…
Q: The following three questions use this data set: 7 8 1 6 9 5 11 2 9 12 The mean of this distribution…
A: Measure of central tendency measures the central or average value of a dataset. Measured of…
Q: At a school, 200 students were asked how long they traveled from home to school Travel time in…
A: B) Median: The median is the value of middle most observation in the data set when the observation…
Q: The number of days travelers purchase their airline tickets ahead of their flights can be modeled by…
A:
Q: Golf scores from a recent WPGA tournament is shown below. Compute the mean, median, mode and…
A: The objective to find the mean, median, mode and midrange of the given data set.
Q: The data show the population (in thousands) for a recent year of a sample of cities in South…
A: Given data is 24 19 19 18 62 18 21 24 20 11 22 33 93 13 21 29 13 12 108 45 20 46 108 39 30 51 The 41…
Q: Examine the data displayed by the box-and-whisker plot. Determine whether the distribution is…
A: Given: From the figure shown above the distribution is skewed to the right. Median from the…
Q: Create a dotplot for the number of cheeseburgers consumed in a givenweek by 10 college students.4…
A: a.The dot plot for the number of cheeseburgers consumed in a given week by 10 college students is…
Q: The data show the population (in thousands) for a recent year of a sample of cities in South…
A: The number of observations (n) is, 26 The ascending order of the data set is,
Q: The scores from 50 psychology students that took a standardized test are summarized in the given…
A:
Q: Jeffery surveyed 50 randomly selected workers at a factory. He collected data about the individual…
A:
Q: 75 39.0000| 10 en 40 De 717e N30 (a) Briefly describe the distribution of the daily sales (shape,…
A: As per our guidelines, we are allowed to answer first three sub-parts only. Thanks Given Histogram…
Q: A study examined how long aircraft air conditioning units operated after being repaired. Here are…
A: Convert this data into grouped form using the class width 40 as Class interval Frequency 0-40…
Q: Lisa took a survey of her classmates' favorite sport and recorded their genders. The results are in…
A: We have to find the marginal relative frequency of survey participants who prefer tennis.
Q: Exhibit 1 Stem-and-leaf of Data: Amount of Money earned in a day in dollars Leaf Unit 10 N = %3D 2…
A: Note: Since you have posted a question with multiple sub-parts, we will solve first three sub-parts…
Q: Exhibit 1 Stem-and-leaf of Data: Amount of Money earned in a day in dollars Leaf Unit = 10 N = * 2 2…
A: Stem-and-leaf data is given with leaf unit 10.
Q: Determine whether the graphs below could represent a variable with a normal distribution. Explain…
A: Hi! Thank you for the question, As per the honor code, we are allowed to answer three sub-parts at a…
Q: Which is a statistical graph that displays only the range of values on the horizontal axis? Dot Plot…
A: We will find the graph.

Step by step
Solved in 2 steps with 1 images

- The arrival rate of patients at a hospital counter follows Poisson distribution with a mean of 25 per hour. The service rate of the treatment to patients also follows Poisson distribution with a mean of 45 per hour.d) Find Ls, Lq, Ws and WqHow can engaged couples improve their chances of a happy marriage? Olthoff (1989) tested the communication quality of couples three months before and again three months after marriage. The data is for the husbands only of one random sample of 10 couples who had received ordinary (very minimal) premarital counseling from the ministers who were going to marry them. The scores are for communication quality. Test to see if the scores changed after three months of marriage. The population of difference in communication scores is normally distributed. Test at the 5% level. Before After 126 115 133 125 126 96 115 115 108 119 109 82 124 93 98 109 95 72 120 104(a) Consider a distribution or a data set with different values of mean, median and mode. Comment upon the shape of such a distribution in terms of the spread of the frequencies. What will be the relation between the mean, median and mode in such a case? Compare the shape of such a distribution with the one whose mean, median and mode are equal to each other.
- A sampling distribution of means for samples of students taking the SAT exam has a population mean of 500 and a standard error of 200. What proportion of sample means would fall between the population mean and a sample mean of 800?Describing the sampling distribution of the sample means from an infinite population The heights of male college students are normally distributed with mean of 68 inches and a standard deviation of 3 inches. If 80 samples consisting of 25 students each are drawn from the population, what would be the expected mean and standard deviation of the resulting sampling distribution of the means. With solutionA doctor in the oncology department of a hospital surveyed the breathing rateof cancer patients. The mean and standard deviation of breathing rates for agroup of patients are 12 and 2.3 breaths per minute, respectively. The proportion of the patients having breathing rates from 7.4 to 16.6 breaths per minute. Recalculate the answer of proportion if the breathing rates are distributed in a bell shaped distribution.
- The mean time to complete a task is 727 millisecond for 3rd graders and 532 milliseconds for 5th graders. The variances of the two grades are 12,000 for 3rd graders and 10,000 for 5th graders. The times for both grades are normally distributed. You randomly sample 12 3rd graders and 14 5th graders. What is the probability that the mean time of the 3rd graders will exceed the mean time of the 5th graders by 150 msec or more?TRUE OR FALSE: The mean for the distribution of sample means is always equal to the mean for the population of scores from which the samples were drawn. TRUE OR FALSE: If samples are selected from a right-skewed population of scores, and each sample containsn= 10 scores, then the distribution of sample means will be normal.The density of people per square kilometer for African countries is in table #2.2.11 ('Density of people,' 2013). Create a frequency distribution and a relative frequency distribution using 7 classes. a) Since data were collected for variable(s), the correct graph to make is a . b) Using the formula class width = (maxX - minX)/(number of classes) and rounding up to the next whole number, the class width is Complete the frequency/relative frequency table using 7 classes. Round relative frequencies to 3 decimal places.
- he average number of cavities that thirty-year-old Americans have had in their lifetimes is 8. Do twenty-year-olds have a different number of cavities? The data show the results of a survey of 15 twenty-year-olds who were asked how many cavities they have had. Assume that the distribution of the population is normal. 6, 10, 6, 9, 8, 7, 5, 10, 6, 8, 10, 4, 8, 4, 6 The null and alternative hypotheses would be: H0:: ? μ p Correct Select an answer = ≠ < > H1: ? μ p Correct Select an answer ≠ > = < The p-value = (Please show your answer to 4 The p-value is ? > ≤ α Interpret the p-value in the context of the study. If the population mean number of cavities for twenty-year-olds is 8 and if you survey another 15 twenty-year-olds, then there would be a 12.64547596% chance that the sample mean for these 15 twenty-year-olds would either be less than 7.13 or greater than 8.87. There is a 12.64547596% chance of a Type I error. There is a…The time it takes for a statistics professor to mark a single midterm test is normally distributed with a mean of 4.6 minutes and a standard deviation of 2.1 minutes. There are 61 students in the professor's class. What is the probability that he needs more than 5 hours to mark all of the midterm tests? Probability =Inclusions are defects in poured metal caused by contaminants. The number of (large) inclusions in cast iron follows a Poisson distribution with a rate of 1.9 per cubic millimetre. What is the volume of material to inspect such that the probability of at least one inclusion is 0.99? Please enter the answer to 2 decimal places.

