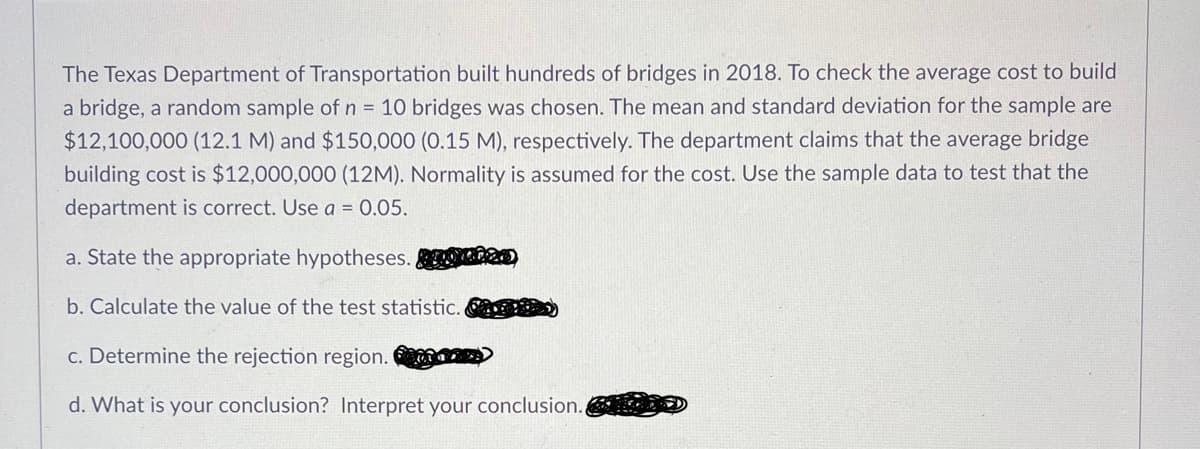
The Texas Department of Transportation built hundreds of bridges in 2018. To check the average cost to build a bridge, a random sample of n = 10 bridges was chosen. The mean and standard deviation for the sample are $12,100,000 (12.1 M) and $150,000 (0.15 M), respectively. The department claims that the average bridge building cost is $12,000,000 (12M). Normality is assumed for the cost. Use the sample data to test that the department is correct. Use a = 0.05. a. State the appropriate hypotheses. b. Calculate the value of the test statistic. c. Determine the rejection region. d. What is your conclusion? Interpret your conclusion..
The Texas Department of Transportation built hundreds of bridges in 2018. To check the average cost to build a bridge, a random sample of n = 10 bridges was chosen. The mean and standard deviation for the sample are $12,100,000 (12.1 M) and $150,000 (0.15 M), respectively. The department claims that the average bridge building cost is $12,000,000 (12M). Normality is assumed for the cost. Use the sample data to test that the department is correct. Use a = 0.05. a. State the appropriate hypotheses. b. Calculate the value of the test statistic. c. Determine the rejection region. d. What is your conclusion? Interpret your conclusion..
Glencoe Algebra 1, Student Edition, 9780079039897, 0079039898, 2018
18th Edition
ISBN:9780079039897
Author:Carter
Publisher:Carter
Chapter10: Statistics
Section10.4: Distributions Of Data
Problem 19PFA
Related questions
Question
Need help with part d conclusion

Transcribed Image Text:The Texas Department of Transportation built hundreds of bridges in 2018. To check the average cost to build
a bridge, a random sample of n = 10 bridges was chosen. The mean and standard deviation for the sample are
$12,100,000 (12.1 M) and $150,000 (0.15 M), respectively. The department claims that the average bridge
building cost is $12,000,000 (12M). Normality is assumed for the cost. Use the sample data to test that the
department is correct. Use a = 0.05.
a. State the appropriate hypotheses.
b. Calculate the value of the test statistic. )
c. Determine the rejection region.
d. What is your conclusion? Interpret your conclusion.
Expert Solution
This question has been solved!
Explore an expertly crafted, step-by-step solution for a thorough understanding of key concepts.
Step by step
Solved in 2 steps with 2 images

Recommended textbooks for you

Glencoe Algebra 1, Student Edition, 9780079039897…
Algebra
ISBN:
9780079039897
Author:
Carter
Publisher:
McGraw Hill

Glencoe Algebra 1, Student Edition, 9780079039897…
Algebra
ISBN:
9780079039897
Author:
Carter
Publisher:
McGraw Hill