The table below gives the number of elementary school children in 16 school districts in a particular region. (a) Complete the cumulative frequency distribution. Students in a District Cumulative (a) Construct a cumulative frequency distribution. (b) Construct a cumulative relative frequency distribution. (c) Draw a frequency polygon. (d) Draw a relative frequency ogive. Frequency 1000-1999 2000-2999 8 3000-3999 14 Number of Elementary School Students in 16 School Districts 4000-4999 16 2400 1557 3110 1015 2500 1260 3250 4800 (b) Complete the cumulative relative frequency distribution. 1050 3640 1755 4400 3935 3740 Students in a Cumulative 1213 3660 District Relative Frequency 1000-1999 2000-2999 3000-3999 4000-4999 (Round to three decimal places as needed.)
The table below gives the number of elementary school children in 16 school districts in a particular region. (a) Complete the cumulative frequency distribution. Students in a District Cumulative (a) Construct a cumulative frequency distribution. (b) Construct a cumulative relative frequency distribution. (c) Draw a frequency polygon. (d) Draw a relative frequency ogive. Frequency 1000-1999 2000-2999 8 3000-3999 14 Number of Elementary School Students in 16 School Districts 4000-4999 16 2400 1557 3110 1015 2500 1260 3250 4800 (b) Complete the cumulative relative frequency distribution. 1050 3640 1755 4400 3935 3740 Students in a Cumulative 1213 3660 District Relative Frequency 1000-1999 2000-2999 3000-3999 4000-4999 (Round to three decimal places as needed.)

MATLAB: An Introduction with Applications
6th Edition
ISBN:9781119256830
Author:Amos Gilat
Publisher:Amos Gilat
Chapter1: Starting With Matlab
Section: Chapter Questions
Problem 1P

Related questions
Question
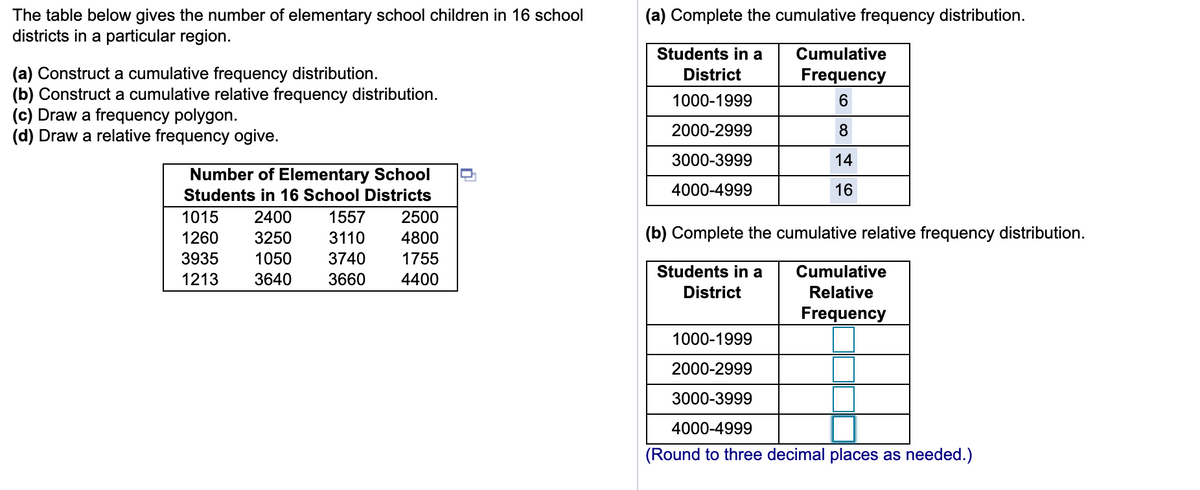
Transcribed Image Text:The table below gives the number of elementary school children in 16 school
districts in a particular region.
(a) Complete the cumulative frequency distribution.
Students in a
Cumulative
(a) Construct a cumulative frequency distribution.
(b) Construct a cumulative relative frequency distribution.
(c) Draw a frequency polygon.
(d) Draw a relative frequency ogive.
District
Frequency
1000-1999
6.
2000-2999
8
3000-3999
14
Number of Elementary School
Students in 16 School Districts
4000-4999
16
1015
2400
1557
2500
1260
3250
3110
4800
(b) Complete the cumulative relative frequency distribution.
3935
1050
3740
1755
Students in a
Cumulative
1213
3640
3660
4400
District
Relative
Frequency
1000-1999
2000-2999
3000-3999
4000-4999
(Round to three decimal places as needed.)
Expert Solution
This question has been solved!
Explore an expertly crafted, step-by-step solution for a thorough understanding of key concepts.

This is a popular solution!

Trending now
This is a popular solution!

Step by step
Solved in 4 steps with 1 images

Knowledge Booster


Learn more about
Need a deep-dive on the concept behind this application? Look no further. Learn more about this topic, statistics and related others by exploring similar questions and additional content below.Recommended textbooks for you
MATLAB: An Introduction with Applications
Statistics
ISBN:
9781119256830
Author:
Amos Gilat
Publisher:
John Wiley & Sons Inc

Probability and Statistics for Engineering and th…
Statistics
ISBN:
9781305251809
Author:
Jay L. Devore
Publisher:
Cengage Learning

Statistics for The Behavioral Sciences (MindTap C…
Statistics
ISBN:
9781305504912
Author:
Frederick J Gravetter, Larry B. Wallnau
Publisher:
Cengage Learning
MATLAB: An Introduction with Applications
Statistics
ISBN:
9781119256830
Author:
Amos Gilat
Publisher:
John Wiley & Sons Inc
Probability and Statistics for Engineering and th…
Statistics
ISBN:
9781305251809
Author:
Jay L. Devore
Publisher:
Cengage Learning
Statistics for The Behavioral Sciences (MindTap C…
Statistics
ISBN:
9781305504912
Author:
Frederick J Gravetter, Larry B. Wallnau
Publisher:
Cengage Learning

Elementary Statistics: Picturing the World (7th E…
Statistics
ISBN:
9780134683416
Author:
Ron Larson, Betsy Farber
Publisher:
PEARSON

The Basic Practice of Statistics
Statistics
ISBN:
9781319042578
Author:
David S. Moore, William I. Notz, Michael A. Fligner
Publisher:
W. H. Freeman

Introduction to the Practice of Statistics
Statistics
ISBN:
9781319013387
Author:
David S. Moore, George P. McCabe, Bruce A. Craig
Publisher:
W. H. Freeman