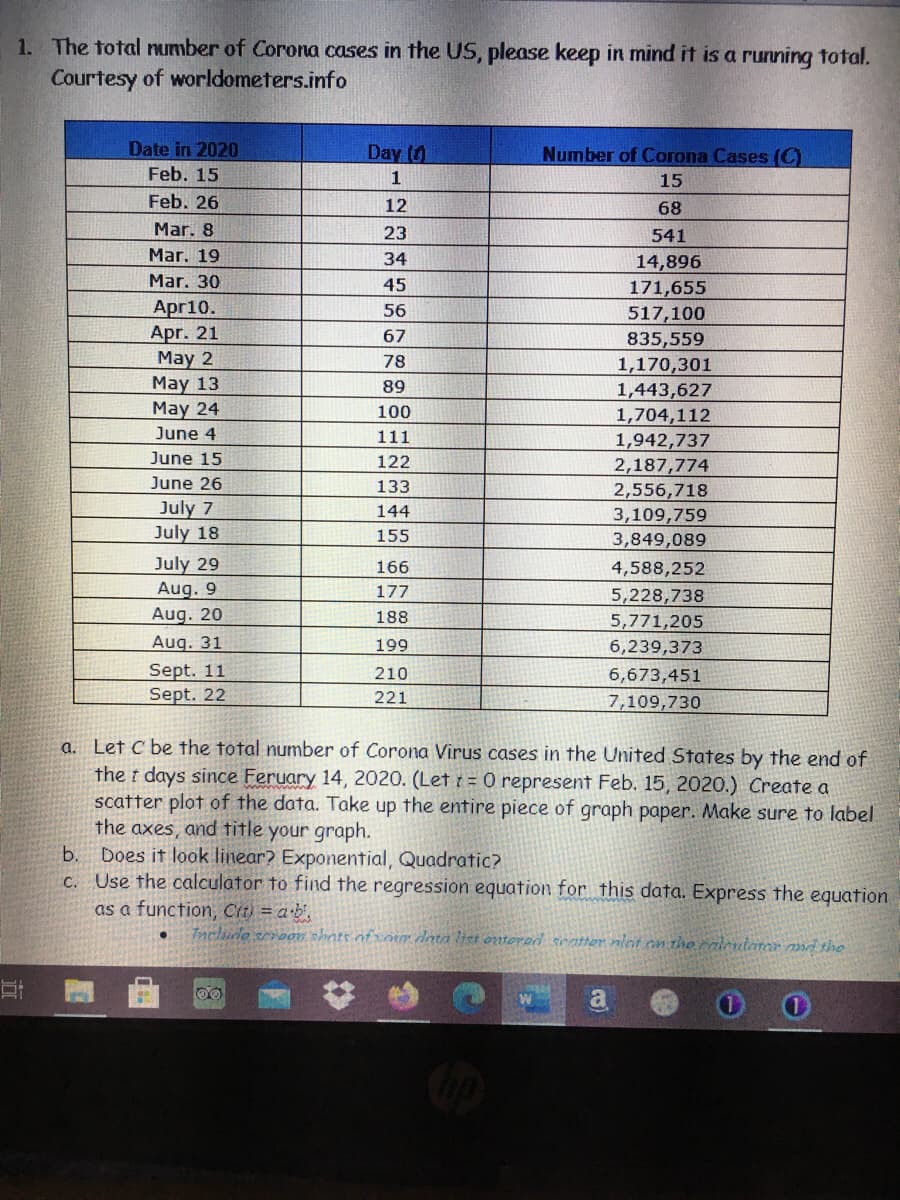
The total number of Corona cases in the US, please keep in mind it is a running total. Courtesy of worldometers.info Date in 2020 Day (0 Number of Corona Cases (C) Feb. 15 1 15 Feb. 26 12 68 Mar. 8 23 541 Mar. 19 34 14,896

Mathematics For Machine Technology
8th Edition
ISBN:9781337798310
Author:Peterson, John.
Publisher:Peterson, John.
Chapter29: Tolerance, Clearance, And Interference
Section: Chapter Questions
Problem 16A: Spacers are manufactured to the mean dimension and tolerance shown in Figure 29-12. An inspector...
icon
Related questions
icon
Concept explainers
Topic Video
Question
1. The total number of Corona cases in the US, please keep in mind it is a running total.
Courtesy of worldometers.info
Date in 2020
Feb. 15
Day (
Number of Corona Cases (C)
1
15
Feb. 26
12
68
Mar. 8
23
541
Mar. 19
34
14,896
171,655
517,100
Mar. 30
45
Apr10.
Apr. 21
May 2
May 13
May 24
June 4
56
67
835,559
1,170,301
1,443,627
78
89
100
1,704,112
1,942,737
111
June 15
122
2,187,774
June 26
133
July 7
July 18
2,556,718
3,109,759
144
155
3,849,089
July 29
Aug. 9
Aug. 20
Aug. 31
166
4,588,252
177
5,228,738
5,771,205
188
199
6,239,373
Sept. 11
Sept. 22
210
6,673,451
221
7,109,730
a. Let C be the total number of Corona Virus cases in the United States by the end of
the r days since Feruary 14, 2020. (Let r = 0 represent Feb. 15, 2020.) Create a
scatter plot of the data. Take up the entire piece of graph paper. Make sure to label
the axes, and title your graph.
Does it look linear? Exponential, Quadratic?
c. Use the calculator to find the regression equation for this data. Express the equation
as a function, Cit) = a b
b.
7nclide sroon shots of xorm data liet ontored seatter lat on the caientaror and the
Transcribed Image Text:1. The total number of Corona cases in the US, please keep in mind it is a running total. Courtesy of worldometers.info Date in 2020 Feb. 15 Day ( Number of Corona Cases (C) 1 15 Feb. 26 12 68 Mar. 8 23 541 Mar. 19 34 14,896 171,655 517,100 Mar. 30 45 Apr10. Apr. 21 May 2 May 13 May 24 June 4 56 67 835,559 1,170,301 1,443,627 78 89 100 1,704,112 1,942,737 111 June 15 122 2,187,774 June 26 133 July 7 July 18 2,556,718 3,109,759 144 155 3,849,089 July 29 Aug. 9 Aug. 20 Aug. 31 166 4,588,252 177 5,228,738 5,771,205 188 199 6,239,373 Sept. 11 Sept. 22 210 6,673,451 221 7,109,730 a. Let C be the total number of Corona Virus cases in the United States by the end of the r days since Feruary 14, 2020. (Let r = 0 represent Feb. 15, 2020.) Create a scatter plot of the data. Take up the entire piece of graph paper. Make sure to label the axes, and title your graph. Does it look linear? Exponential, Quadratic? c. Use the calculator to find the regression equation for this data. Express the equation as a function, Cit) = a b b. 7nclide sroon shots of xorm data liet ontored seatter lat on the caientaror and the
Expert Solution
trending now

Trending now

This is a popular solution!

steps

Step by step

Solved in 2 steps with 2 images

Blurred answer
Knowledge Booster
Application of Algebra
Learn more about
Need a deep-dive on the concept behind this application? Look no further. Learn more about this topic, statistics and related others by exploring similar questions and additional content below.
Recommended textbooks for you
Mathematics For Machine Technology
Advanced Math
ISBN:
9781337798310
Author:
Peterson, John.
Publisher:
Cengage Learning,