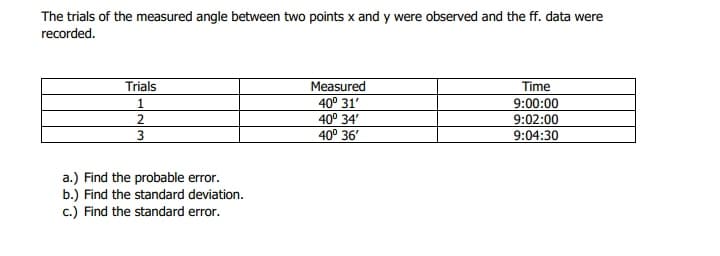
The trials of the measured angle between two points x and y were observed and the ff. data were recorded. Measured 40° 31' 40° 34' 40° 36' Time 9:00:00 9:02:00 9:04:30 Trials 2 3 a.) Find the probable error. b.) Find the standard deviation. c.) Find the standard error.
Q: Consider a normally distribr deviation of 10. Find P(90<
A: mean =85 standard deviation =10 to find P(90<X<100)
Q: 2. Fit a straight line to the following data and estimate the production in the year 1957. FIG. 01…
A: Calculate Fitting a straight line - Curve fitting using Least square method X Y 1951 10 1961…
Q: Suppose that the mean systolic blood pressure for women over age seventy is 131 mamlig (milimeters…
A: (a) Determine the two values that the approximately 68% of women over seventy blood pressures…
Q: The average life of Canadian women is 73.75 years and the standard deviation of the women's life…
A: Let X represent the random variable Mean=73.75 SD=6.5
Q: Q) Fit the curve of the form ab* to the following data, then find the %3D standard deviation. X 3 4…
A: Given, The data table is: X 3 4 5 6 7 Y 1.8 2.5 3.6 4.7 6.6 To find, Fit the curve y…
Q: etters in each word, and obtain the mean and standard deviation of the yes were blue blue as autumn…
A: *Answer:
Q: Given the two side lengths (b and c) and one interior angle (a) between these two sides of the below…
A: Give that α=130.2080gb=280.50 m±20 cmc=170.40 m±15 cm We know that…
Q: Given the following data in measuring a distance of a certain line. DISTANCE 740.53 740.59 740.57…
A: Given data: Distance Number of measurements 740.53 4 740.59 3 740.57 6 740.53 7
Q: A distance AB is observed repeatedly using the same equipment and procedures, and the results, in…
A: sample size (n) = 12 a) The lines most probable length sample mean (x̄) = Σx /n= 784.825/12=…
Q: Using the diagram provided, determine the measurements for each of the following.
A:
Q: Given the mean and standard deviation of a normally distributed set of scores, determine the…
A: Given that x = 35 , μ = 18 , ? = 7
Q: The population of Douglas fir trees was shown to have an approximately normal diameter distribution…
A:
Q: H.W. conruct frequency odi'stri bu tion for the fo il owing data and determine xi , R.freq,…
A:
Q: the distribution in order to answer these questions. çet weights lie between and ge of the widget…
A:
Q: Use the following information for Exercises 16.10 to 16.12. The distribution of blood cholesterol…
A: Introduction: The population standard deviation of cholesterol levels of males in the age group of…
Q: The following data represent the muzzle velocity (in feet per second) of rounds fired from a…
A: Given: n=6 α=0.01
Q: The number of milliseconds required for a light beam to go from A to B is given below. Find the…
A: Given the data on the number of milliseconds required for a light beam to go from A to B. We have…
Q: and post-test samples for n = 49 subjects. The average d deviation of the differences of sa = 46.7.…
A: Given data : sample size, n = 49 sample mean, = 16.0 sample standard deviation,s= 46.7 population…
Q: Approximately the greatest error in calculating the hypotenuse of a right triangle from the lengths…
A:
Q: Given Z=1, standard deviation=2, and u=12, find "x bar"
A: It is given that the mean and standard deviation are 12 and 2, respectively.
Q: The following data represent the muzzle velocity (in feet per second) of rounds fired from a 155-mm…
A: “Since you have posted a question with multiple sub-parts, we will solve first three subparts for…
Q: Given that it is normally distributed with a standard deviation of 8.025 cm. State the mode of the…
A:
Q: H.W //2 Determine the estimated error in the length of AE, which was measured in sections as…
A: Formula used: Estimated Error=AB2+BC2+CD2+DF2
Q: For numbers 9 to 11, The principal of Mapayapa Integrated National High School claimed average…
A: Given that Sample size n =15 Standard deviation =400
Q: following decisions would result from a Type I error?
A: Here use basic of type 1 error
Q: 1. What is the meaning of а. а? b. B? C. type l error? d. type Il error? e. the p-value? f. Ho? g.…
A: α significance level in hypothesis test, or acceptable probability of a Type I error β the…
Q: Find the standard deviation for the given data n- 48, Σίx, = 1620 , Σix? = 6640ο , ΣΧ-180 %3D O a.…
A: Given that, n = 48∑fixi=1620∑fixi2=66400∑xi=180
Q: (a) Determine the standard deviation of recumbent length for all 20 observations. cm (Round to two…
A: here sample size n= 20 here given data recumbent length xi = recumbent length
Q: From the following information, find the standard deviation of x and y variable: Σy= 250 Σχ=235, Ex²…
A:
Q: inky measured an angle between two points A and B. From his field notes given below, compute for the…
A:
Q: Five of your classmates measured the diagonal length of the blackboard. Classmate A measured it as…
A: Average and standard deviation are measures of central tendency and variance respectively.
Q: Choose one of the answer options below: D. Since it is close to normal with a smaller standard…
A: From the given information, A hypothetical distribution for a population of test scores has a mean…
Q: (a) Suppose that X, and X2 are independent rv's with means 5 and 10 kips, respectively, and standard…
A: Hello! As you have posted more than 3 sub parts, we are answering the first 3 sub-parts. In case…
Q: Find the standard deviation using propagation of error for the following equation: t1/t2 N =
A: From the given information, N=t1/t2 Here, t1=185.01+/-3.95 and t2=264.08+/-3.33 Standard…
Q: Given HO: p = 0.85 and alpha = 0.10, which level of confidence should you use to ... %3D a. 95% b.…
A: Solution: From the given information, alpha = 0.10.
Q: Given the following data in measuring a distance of a certain line. DISTANCE 740.53 740.59 740.57…
A: Given data: Distance No. of Measurements 740.53 4 740.59 3 740.57 6 740.53 7 Total 20…
Q: The following data represent the muzzle velocity (in feet per second) of rounds fired from a…
A: Given: The muzzle velocity (in feet per second) of rounds fired from a 155-mm gun. x~N(μ,σ)…
Q: For the data set given Find the standart error ot the estimate Sy/x 1 9 2,5 3,5 5S O 1.291 O 1.422…
A:
Q: O find the standard deviation of y. ® find p (y 7 5i1 minutes. 5.1
A:
Q: 4. An angle was measured six times, the observed values being 49°23'00", 49°23'20", 49°22'40",…
A:
Q: Given the following data in measuring a distance of a certain line. DISTANCE NO. OF MEASUREMENTS…
A: Given that, DISTANCE NO. OF MEASUREMENTS 740.53 4 740.59 3 740.57 6 740.53 7
Q: A distance AB is observed repeatedly using the same equipment and procedures, and the results, in…
A:
Q: The following data represent the muzzle velocity (in feet per second) of rounds fired from a…
A: (a) Reason why the data is matched-pairs data:The data shows that the muzzle velocity of rounds…
Q: Q) Fit the curve of the form y = ab* to the following data, then find the standard deviation. 3 4 5…
A: Given that we need to fit the curve y = abx to the following data. Now applying loge on both sides…
Q: A distance AB is observed repeatedly using the same equipment and procedures, and the results, in…
A:
Q: Given that the mean μ=20 and the standard deviation σ=4, find P (x<25)
A: Given that. X~N( μ , ?2 ) μ = 20 , ? = 4 Z-score =( x - μ )/?
Q: Find the expected frequency, Ei, for the given values of n and pi. n=170, pi=0.3…
A:
Q: 2. Suppose you begin the day at an elevation of E feet. After some hiking, you are at an elevation…
A: Topic -absolute value function
Q: lues of modulus of elasticity (MOE., the ratio of stress, i.e., force per unit area, to strain,…
A:
Q: Q) Fit the curve of the form y = ab* to the following data, then find the standard deviation. 3 4 5…
A: x y y2 3 1.8 3.24 4 2.5 6.25 5 3.6 12.96 6 4.7 22.09 7 6.6 43.56 ∑y =19.2∑y2=88.1mean…
Step by step
Solved in 2 steps with 2 images
- Jinky measured an angle between two points A and B. From his field notes given below, compute for the following: Find the probable error. Find the standard deviation. Find the standard error.Given that it is normally distributed with a standard deviation of 8.025 cm. Find the range of the diameter that is two standard deviations from themean. Hence, state the proportion of the tubes with the diameters inthis range.Given that it is normally distributed with a standard deviation of 8.025 cm. State the mode of the population for the diameter of the tubes. Brieflyexplain the answer.
- average heigth is 163 cm, standart deviation is 10 cm. compute p(X>168 cm) ?Find the standard deviation for each object.Assume the readings on thermometers are normally distributed with a mean of 0°C and a standard deviation of 1.00°C. Find the probability that a randomly selected thermometer reads between −2.25 and −1.67 and draw a sketch of the region. Click
- Assume the readings on thermometers are normally distributed with a mean of 0°C and a standard deviation of 1.00°C. Find the probability that a randomly selected thermometer reads between −0.81 and −0.01 and draw a sketch of the regionGiven the following data in measuring a distance of a certain line. DISTANCE NO. OF MEASUREMENTS 740.53 4 740.59 3 740.57 6 740.53 7 Calculate the standard deviation of any single observation. A.±0.0167 C. ±0.0347 B. ±0.0247 D. ±0.0055 ps. with step by step solution pleaseThe heights of men are normally distributed with a mean of 174.12 cm and astandard deviation of 7.10 cm. Find the z-scores of the following values. (Show work.)(a) LeBron James at 203 cm.(b) The tallest living men Sultan Kosen at 251 cm.(c) The shortest man Chandra Bahadur Dangi at 54.6 cm.(d) The British Airways max height of cabin crew at 185.4 cm.
- For the given values , calculate the standard deviation .The attached plots were constructed using a sample of 272 observations. Each observation gives the elapsed time (in minutes) of an eruption of Old Faithful geyser in Yellowstone national park. d. A sample of 6 durations have values: 4.850, 2.200, 2.900, 4.367, 1.750, 3.966. What is the mean of this sample? e. What is the standard deviation of the sample in d. if ∑ni=1x2i=74.635∑i=1nxi2=74.635?( attached as pic) f. Give the shape and parameters of the sampling distribution of the sample mean when n=272n=272 if μ=3.4μ=3.4 and σ=1.16σ=1.16. Explain how you know the shape the distribution takes on.Assume the readings on thermometers are normally distributed with a mean of 0°C and a standard deviation of 1.00°C. Find the probability that a randomly selected thermometer reads between −2.09 and −0.96 and draw a sketch of the region. What is the probability?