2. Fit a straight line to the following data and estimate the production in the year 1957. FIG. 01 YEAR: 1951 1961 1971 1981 1991 Production in 10 12 08 10 13 the Thousand tons: Hint: take the deviations of X = x-x and Y y-y at Y = a + bX
2. Fit a straight line to the following data and estimate the production in the year 1957. FIG. 01 YEAR: 1951 1961 1971 1981 1991 Production in 10 12 08 10 13 the Thousand tons: Hint: take the deviations of X = x-x and Y y-y at Y = a + bX

Algebra & Trigonometry with Analytic Geometry
13th Edition
ISBN:9781133382119
Author:Swokowski
Publisher:Swokowski
Chapter7: Analytic Trigonometry
Section7.6: The Inverse Trigonometric Functions
Problem 94E

Related questions
Question
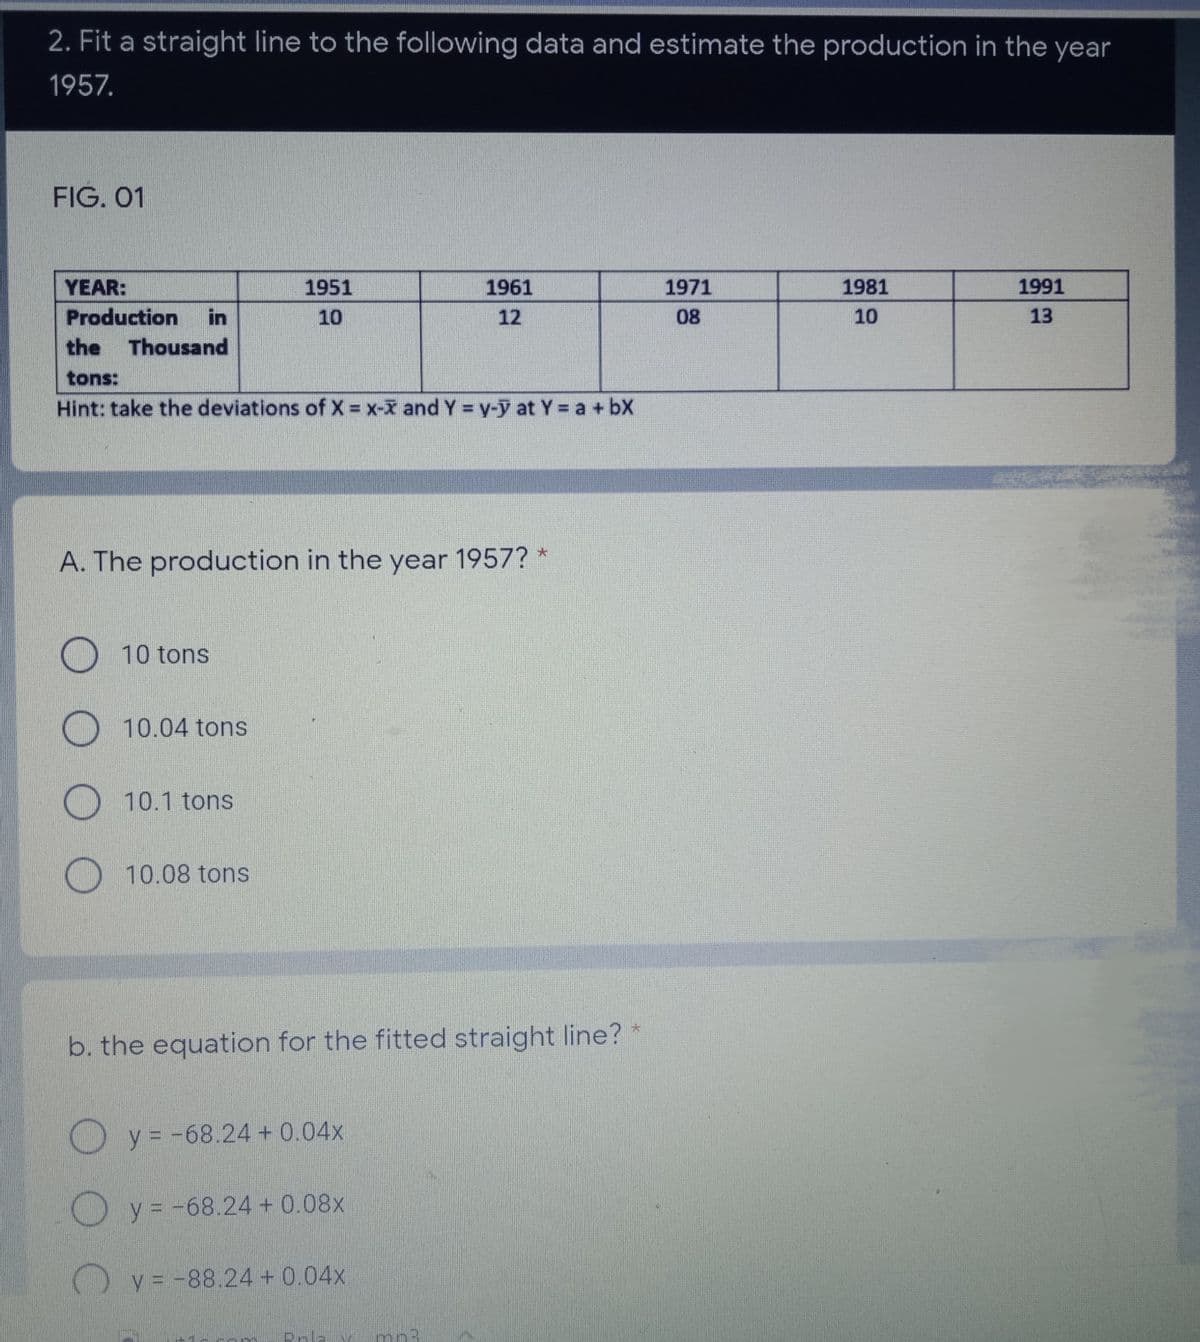
Transcribed Image Text:2. Fit a straight line to the following data and estimate the production in the year
1957.
FIG. 01
YEAR:
1951
1961
1971
1981
1991
Production
in
10
12
08
10
13
the
Thousand
tons:
Hint: take the deviations of X = x-x and Y = y-y at Y a + bX
A. The production in the year 1957? *
O 10 tons
O 10.04 tons
O10.1 tons
10.08 tons
b. the equation for the fitted straight line?
O y = -68.24 + 0.04x
O y = -68.24 + 0.08x
) y = -88.24 + 0.04x
Bola
mn3
Expert Solution
This question has been solved!
Explore an expertly crafted, step-by-step solution for a thorough understanding of key concepts.

Step by step
Solved in 2 steps

Recommended textbooks for you
Algebra & Trigonometry with Analytic Geometry
Algebra
ISBN:
9781133382119
Author:
Swokowski
Publisher:
Cengage
Algebra & Trigonometry with Analytic Geometry
Algebra
ISBN:
9781133382119
Author:
Swokowski
Publisher:
Cengage