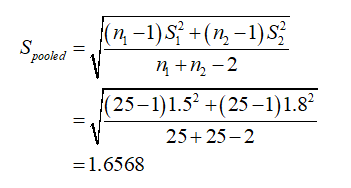
The two companies manufacture a piece of plastic used in automobile production. This plastic piece is subject to wear during use. Therefore, it is desired to compare the amount of wear of plastic parts produced by the two companies. Each Friction wear was applied by taking random samples of 25 units from both companies and after 1000 cycles, wear amounts were observed. The average wear for the first company was 20mg / 1000 cycles and the standard deviation of wear was 1.5mg / 1000 cycles, the average for the second company was 12mg / 1000 cycles and the wear standard deviation was 1.8mg / 1000 cycles. It is assumed that the wear amount of both masses shows normal distribution with the same variance. a) For the difference between the average of wear amount


The two companies manufacture a piece of plastic used in automobile production. This plastic piece is subject to wear during use. Therefore, it is desired to compare the amount of wear of plastic parts produced by the two companies. Each Friction wear was applied by taking random samples of 25 units from both companies and after 1000 cycles, wear amounts were observed. The average wear for the first company was 20mg / 1000 cycles and the standard deviation of wear was 1.5mg / 1000 cycles, the average for the second company was 12mg / 1000 cycles and the wear standard deviation was 1.8mg / 1000 cycles. It is assumed that the wear amount of both masses shows
a) For the difference between the average of wear amount of plastic parts produced by the two companies, establish my confidence interval of 98%. Interpret the result. Can it be said that the amount of wear of the plastic material produced by the first company is higher?
b) For the average amount of wear of the plastic part produced by the second company, establish a 95% confidence interval. Interpret the result.
a)
Consider the pooled variance,
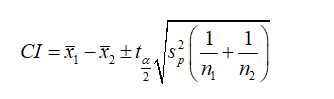
Formula for confidence interval between two means:
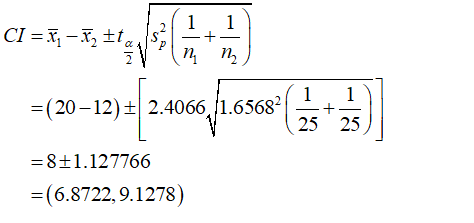
The level of confidence is 0.98. Therefore, the level of significance is 1-0.98=0.02 and α/2=0.02/2=0.01. The degrees of freedom is 48.
From the t distribution table, the critical value corresponding with 48 degrees of freedom and 0.01 level of significance in “Area in one tail” is 2.4066.
Therefore,
Interpretation:
There is a 98% chance that the difference between the average of wear amount of plastic parts produced by the two companies is lies between 6.8722 and 9.1278.
Null hypothesis:
H0: The amount of wear of the plastic material produced by the first company is not higher than the second company.
Alternative hypothesis:
H1: The amount of wear of the plastic material produced by the first company is higher than the second company.
Rejection Rule based on Confidence interval:
- If the hypothesized difference lies between the confidence limits, do not reject the null hypothesis.
- If the hypothesized value lies outside the confidence limits, reject the null hypothesis.
Conclusion:
The hypothesized difference is 0.
The 98% confidence interval is (6.8722, 9.1278).
That is, the hypothesized difference does not lies between the limits.
From the rejection rule, reject the null hypothesis.
It can be concluded that the amount of wear of the plastic material produced by the first company is higher than the second company.

Step by step
Solved in 3 steps with 4 images


