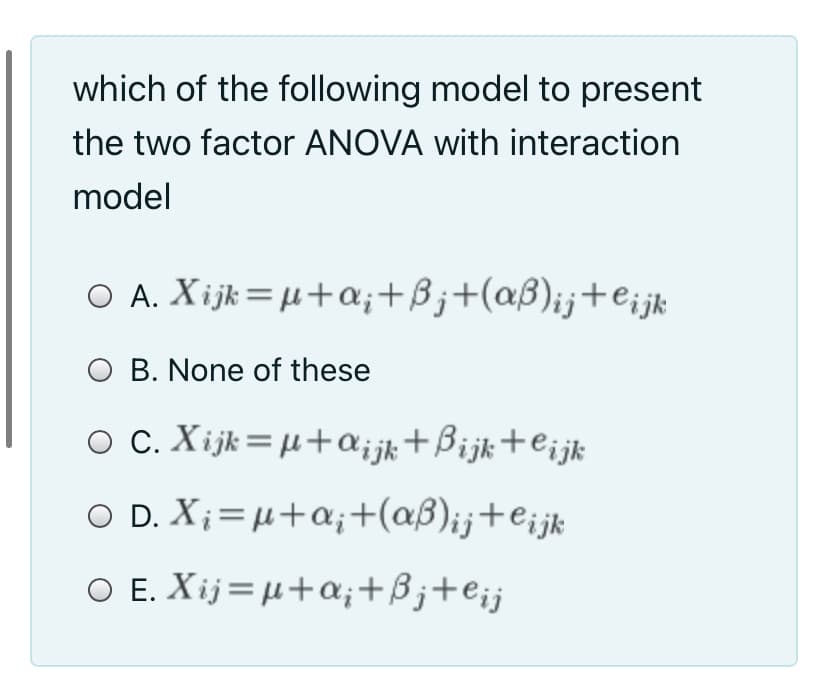
the two factor ANOVA with interaction model O A. Xijk= µ+a;+B;+(aß)ij+e¡jk O B. None of these


Q: An engineer has set up a DOE (design-of-experiment) to test the wear of laminated materials and how…
A: Given information : No. Of replication (r)=2 No. Of treat. (Glue)=2 No. Of block (Filler)=2…
Q: cm) and weights (kg) are measured for 100 randomly selected adult males, and range from heights of…
A:
Q: Let Y,, Y2, Y3, and Y, be independent, identically distributed random variables from a population…
A:
Q: 18
A: Here use t test of paired data
Q: An artide in the IEEE Transactions on Components, Hybrids, and Manufacturing Technology (Vol. 15,…
A:
Q: In a public opinion survey, 60 out of a sample of 100 high income voters and 40 out of a sample of…
A: We have given that Sample sizes n1= 100 , n2= 75 Favorable cases x1= 60 , x2= 40 Sample proportion…
Q: By selecting a larger alpha level, a researcher is ______. a. attempting to make it…
A: Effects on increasing the larger value of Alpha 1. When we increase Alpha then we are trying to…
Q: Find the t values that form the boundaries of the critical region for a two-tailed test with a = .05…
A: 1) Introduction :- Given :- We are given that r2 is equal to 0.25. We have to interpret it.
Q: Professor Cambridge is not familiar with his students, he assumes that about 70% of students spend ≥…
A:
Q: Suppose X₁, X2,..., X30 is a random sample from a normal population with mean and variance 10. Find…
A:
Q: The null hypothesis is Ho: H1 = H2 and the alternative hypothesis is as specified. The provided data…
A:
Q: 14. Which of the following assumptions must be made in order to use the pooled least squares…
A:
Q: The dry shear strength of birch plywood bonded with different resin glues was studied with a…
A: Here, the total sample size = N=16N = 16 Total degrees of freedom = dftotal=16−1=15df_{total} =…
Q: The test statistic of z=−2.64 is obtained when testing the claim that p<0.56. a. Using a…
A: Given: The claim suggests that the test is left tailed.
Q: If a dependent-samples t-test shows a significant difference between two conditions with α = .01,…
A: A hypothesis test results indicate the statistical significance of the difference while the Cohen's…
Q: Video Games. A pathological video game user (PVGU) is a video game user that averages 31 or more…
A:
Q: A medical researcher is interested in determining if there is a relationship between adults over 50…
A: It is needed to test, whether regular exercise and low, moderate, and high blood pressure are…
Q: Suppose that you are given two random variables x and y and you take measurements and obtain x1 =…
A: Given Data Since X values were in % ages, we converted them into decimal x y 0.023 60 -0.076…
Q: What principle of design experiment that suggest to control as much aa possible theconditions in the…
A: We have given that What principle of design experiment that suggest to control as much aa possible…
Q: Cloud seeding has been studied for many decades as a weather modification procedure (for an…
A: Introduction: Denote μ as the true population mean amount of rainfall from seeded clouds.
Q: Car owner: Collect data in the following table about foreign cars and local cars through customers…
A: Given: Significance level α = 0.01 Formula Used: Test-statistic χ2 = ∑O-E2E E = RT×CTN RT = Row…
Q: Outpatients (N = 36) with type 2 diabetes were referred back to the hospital because of the risk of…
A: Given information: The data represents the values of demographic data about the patient group.
Q: Consider the single-factor completely randomized design with a treatments and n replicates. If the…
A: Given: Let's consider there is a completely randomized design with n duplicates for a treatment. Any…
Q: The following output summarizes a portion of the results for a two-way ANOVA experiment with no…
A: a. The mean square of factor is obtained as MSA = SSA/dfA, where SSA is the sum of squares of factor…
Q: Outpatients (N = 36) with type 2 diabetes were referred back to the hospital because of the risk of…
A: Given information: The data represents the values of demographic data about the patient group.
Q: 92 83 80 85 82 78 Degrees of freedom (from calculation or Jamovi): ____________ Critical…
A:
Q: Suppose that in a factorial experiment the following estimates are available: î = 10, a1 = 2, B2 =…
A: # Given : ANOVA model yij=mu+alpha(i)+beta(j) + alpha* beta(ij) mu^=10, alpha1=2, beta(2)=-5 ,…
Q: Suppose that (Y, X;) satisfy the least squares assumptions: A random sample of size n = 250 is drawn…
A:
Q: Let X, and X be two identically distributed random variables with a correlation coefficient equal to…
A: First, we need to find the covariance of X1 and X2 from their correlation coefficient,
Q: A study at the physics laboratory at İstanbul Kültür University is made to examine the defects in an…
A: Chi square test for independence: Chi square test is used to test whether the two categorical…
Q: a. Calculate the rank correlation coefficient. b. Test the hypothesis @.05 level of significance.
A: Use the Excel and Calculate the Correlation Followings are the Steps to Calculate Correlation 1)…
Q: Consider four random variables X,Y, U,V. The covariance between X and Y is 0.92, and the correlation…
A: The correlation coefficient of two random variables lies between -1 and 1. The correlation…
Q: Similarly show that the F-statistic for the interaction is the square of the t-statistic for the…
A:
Q: Heights (cm) and weights (kg) are measured for 100 randomly selected adult males, and range from…
A: Heights(cm) and weights(kg) are measured for 100 randomly selected adult males. Where range of…
Q: Let Y1, Y2, Y3, Y4, and Y, be i.i.d. random variables from a population with mean u and variance o?.…
A: given data let y1,y2,y3,y4 and y5 be random variablesand givenW=18y1+18y2+15y3+15y4+720y5
Q: According to a report an average person watched 4.55 hours of television per day in 2005. A random…
A:
Q: I’m interested in seeing whether or not online supplementary material helps students achieve higher…
A: Given Information: Sample space of Group 1(Online + textbook)=(95, 90, 92, 92, 84, 86, 91, 92, 80,…
Q: The following observations were obtained when conducting a two-way ANOVA experiment with no…
A: SST = 275.667 SSA = 5.667 SSB = 253.167 SSE = 16.83
Q: Four catalysts that may affect the concentration of one component in a three-component liquid…
A:
Q: 20. A researcher conducts an independent-measures, two-factor study with two levels of factor A and…
A: 20. In this study there are two levels of factor A a=2, three levels of factor B b=3 and n = 10…
Q: A study was done to find the relationship of y with five explanatory variables X1, X2, X3, X4 and X5…
A: Now given that the reduced model has the variables X1, X2 and X3. It is also given that n = 20. We…
Q: You are conducting a test of independence for the claim that there is an association between the row…
A:
Q: The results of a two-factor analysis of variance produce df = 2, 36 for the F-ratio for factor A and…
A: If the df for Factor A is a-1 and that of Factor B is b-1, the the AxB interaction effect has…
Q: We have a table of cities and temperatures. Use 1 Way fixed-effects ANOVA to calculate the F value…
A: The given data can be presented as follows to carry out an ANOVA test Orlando Dallas Chicago…
Q: A pharmaceutical company conducts an experiment to test the effect of a new cholesterol medication.…
A: Anova table is used to measure the mean significance between the categorical variable. In which each…
Q: i. Test the following hypothesis with 5% significance level Họ : B1 = 0 На: В 20 ii. Test the…
A: As per our guidelines, we are allowed to answer first three sub-parts only. Thanks This…
Q: A pharmaceutical company has developed a drug that is expected to reduce hunger. To test the drug,…
A: Given: n=9 No. of treatments, k=3 F-ratio =4.36 MS (Within) =3.71 α=0.05
Q: Construct a complete hypothesis test and determine if the two groups have significantly different…
A: Given data, n1=12 x1=51 ss1=808 n2=8 x2=30.5 ss2=154
Q: Assume that you plan to use a significance level of alpha = 0.05 to test the claim that p1 = p2. Use…
A: Given alpha= 0.05 n1 = 50 n2 = 75 x1 = 20 x2 = 15
Q: The test statistic of z = -2.27 is obtained when testing the claim that p < 0.32 Part A: using a…
A: Answer is in step below Thanks!


Step by step
Solved in 2 steps with 1 images


- The researchers reported:" A 2x2 ANOVA revealed, first of all, a main effect for depletion, indicating that depleted individuals generated less ideas (M = 9.40, SD = 5.64) than non-depleted individuals (M = 12.44, SD = 7.34), F (1, 108) = 6.03, p = .016, n2 = .05. This effect was qualified by the expected interaction with [perseverance], F (1,108) = 4.52, p = .036, n2 = .05". What size are the effects for the main effect of depletion and for the interaction between depletion and perseverance, according to Cohen's conventions? a. These are small- to -medium effects b. These are non existent effects c. These are large effects d. We are unable to tell from from the n2 / r2 statisticsA pharmaceutical company wants to test whether Aspirin 1 is as effective as Aspirin 2. A random sample of 400 people with headaches are given Aspirin 1 and 260 report they feel better within 1 hour. Another independent random sample of 350 people with headaches are given Aspirin 2 and 220 report they feel better within 1 hour.a) At the 1% level of significance, does there appear to be a difference in theeffectiveness of the 2 types of Aspirin?b) What is the p-value?A large nationwide survey showed that 65% of high school students like Coca-Cola better than Pepsi. Dr.Johnson conducted a small survey of randomly selected high school students in Michigan and found that 180 ofthe 300 surveyed students liked Coca-Cola better than Pepsi. Test if the proportion of students that preferCoca-Cola over Pepsi is significantly different than the percentage indicated by the nationwide survey with asignificance level of 5%.
- 1) A cement producer, manufactures and then fills 40kg-bags of powder cement on twodistinct production tracks located in separate suburbs. To determine whether differencesexist between the average fill rates for the two tracks, a random sample of 25 bags fromTrack 1 and a random sample of 16 bags from Track 2 were recently selected. Each bag’sweight was measured and the following information measures from the samples arereported:Production ProductionTrack 1 Track 2n1 = 25 n2 = 16x2 = 40.02 x1 = 39.87 s1 = 0.59 s2 = 0.88 Supervision believes that the fill rates of the two tracks are normally distributed with equalvariances.Construct a 95% confidence interval estimate of the true mean difference between the twotracks.--------------------------------------------------------------------------------------------------------------2) Two independent simple random samples were selected from two normallydistributed populations with unequal variances yielded the following information:Sample 1…And conduct a two-factor ANOVA to investigate the effects of gender (The name of the variable in SPSS is "gender" and it has two levels, "male" vs. "female") and "minority classification" (In SPSS, the name of the variable is "minority", its label is "Minority Classification" ,and it has two levels "yes" and "no"; referring to whether an individual is part of a minority or not ) on beginning salary (In SPSS the name of the variable is "salbegin", and its label is "Beginning Salary). Use α = .05 a. If the main effect of Minority Classification is significant, describe the main effect of Minority Classification. Include the overall means and corresponding standard deviations in your description. Example = If there is a main effect of maternal diet, is the main effect of maternal diet significant? Why? Provide F-statistic, df of numerator, df of denominator, and p- value? Yes, the main effect of maternal diet is significant because p is less than alpha, F(1,16) = 40.67, p = .0001And conduct a two-factor ANOVA to investigate the effects of gender (The name of the variable in SPSS is "gender" and it has two levels, "male" vs. "female") and "minority classification" (In SPSS, the name of the variable is "minority", its label is "Minority Classification" ,and it has two levels "yes" and "no"; referring to whether an individual is part of a minority or not ) on beginning salary (In SPSS the name of the variable is "salbegin", and its label is "Beginning Salary). Use α = .05 a. What are the independent variables and what are the two levels or conditions of each independent variable? b. State the three alternative hypotheses in words. State the alternative hypothesis of the interaction in terms of whether the effects of he effect of Minority Classification on Beginning Salary depend on the levels of Gender (i.e., on whether you are a male or a female)
- And conduct a two-factor ANOVA to investigate the effects of gender (The name of the variable in SPSS is "gender" and it has two levels, "male" vs. "female") and "minority classification" (In SPSS, the name of the variable is "minority", its label is "Minority Classification" ,and it has two levels "yes" and "no"; referring to whether an individual is part of a minority or not ) on beginning salary (In SPSS the name of the variable is "salbegin", and its label is "Beginning Salary). Use α = .05 a.If there is a main effect of gender, is the main effect of gender significant? Why? Provide F-statistic, df of numerator, df of denominator, and p- value?And conduct a two-factor ANOVA to investigate the effects of gender (The name of the variable in SPSS is "gender" and it has two levels, "male" vs. "female") and "minority classification" (In SPSS, the name of the variable is "minority", its label is "Minority Classification" ,and it has two levels "yes" and "no"; referring to whether an individual is part of a minority or not ) on beginning salary (In SPSS the name of the variable is "salbegin", and its label is "Beginning Salary). Use α = .05 a. If the Gender by Minority Classification interaction is significant, describe the interaction. Include individual means and their corresponding standard deviations in your description.And conduct a two-factor ANOVA to investigate the effects of gender (The name of the variable in SPSS is "gender" and it has two levels, "male" vs. "female") and "minority classification" (In SPSS, the name of the variable is "minority", its label is "Minority Classification" ,and it has two levels "yes" and "no"; referring to whether an individual is part of a minority or not ) on beginning salary (In SPSS the name of the variable is "salbegin", and its label is "Beginning Salary). Use α = .05 a. If the main effect of Minority Classification is significant, describe the main effect of Minority Classification. Include the overall means and corresponding standard deviations in your description.
- And conduct a two-factor ANOVA to investigate the effects of gender (The name of the variable in SPSS is "gender" and it has two levels, "male" vs. "female") and "minority classification" (In SPSS, the name of the variable is "minority", its label is "Minority Classification" ,and it has two levels "yes" and "no"; referring to whether an individual is part of a minority or not ) on beginning salary (In SPSS the name of the variable is "salbegin", and its label is "Beginning Salary). Use α = .05 a. If there is an interaction, is the interaction significant? That is, does the effect of Minority Classification on Beginning Salary depend on the levels of Gender(i.e., on whether you are a male or a female)? Why? Provide F-statistic, df of the numerator, df of the denominator , and p-value.A random sample of senior citizens living in a retirement village reported that they had an average of 1.42 face-to-face interactions per day with their neighbors. A random sample of those living in age-integrated communities reported 1.58 interactions per day. Is the difference between the two senior citizen groups significant? Please provide t critical, t obtained and your decision. Retirement Community 1 Retirement Community 2 Mean1 = 1.42 Mean2 = 1.58 s1 = 0.10 s2 = 0.78 N1 = 43 N2 = 37In the past decade, two presidential elections in the United States have witnessed very long wait times at precincts (voting stations) in states that ultimately decided the election (Florida in 2000 and Ohio in 2004). In Philadelphia as well, some voters complained about the long lines in some precincts, with most complaints coming from precinct A. In 2004, the average number of voters arriving at Precinct A was 35 per hour and the arrivals of voters was random with inter-arrival times that had a coefficient of variation of 1 (CVa=1). Philadelphia deployed 1 voting machine in Precinct A. Suppose that each voter spent on average 100 seconds in the voting booth (this is the time needed to cast her/his vote using a voting machine), with a standard deviation of 120 seconds. Given the long wait times for Precinct A, the city of Philadelphia is thinking of alternative solutions to improve voting conditions. One of the proposed solutions is as follows. Proposal 1: Deploy an additional voting…


