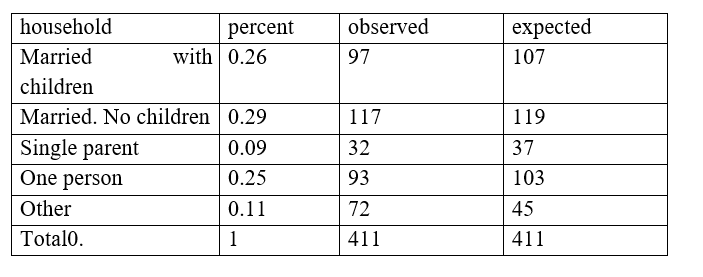
The type of household for the U.S. population and for a random sample of 411 households from a community in Montana are shown below. Observed Number Percent of U.S. Type of Household of Households in the Community Households 26% 29% Married with children Married, no children Single parent One person Other (e.g., roommates, siblings) 97 117 9% 32 25% 93 11% 72 Use a 5% level of significance to test the claim that the distribution of U.S. households fits the Dove Creek distribution.
The type of household for the U.S. population and for a random sample of 411 households from a community in Montana are shown below. Observed Number Percent of U.S. Type of Household of Households in the Community Households 26% 29% Married with children Married, no children Single parent One person Other (e.g., roommates, siblings) 97 117 9% 32 25% 93 11% 72 Use a 5% level of significance to test the claim that the distribution of U.S. households fits the Dove Creek distribution.

Holt Mcdougal Larson Pre-algebra: Student Edition 2012
1st Edition
ISBN:9780547587776
Author:HOLT MCDOUGAL
Publisher:HOLT MCDOUGAL
Chapter11: Data Analysis And Probability
Section: Chapter Questions
Problem 8CR

Related questions
Question
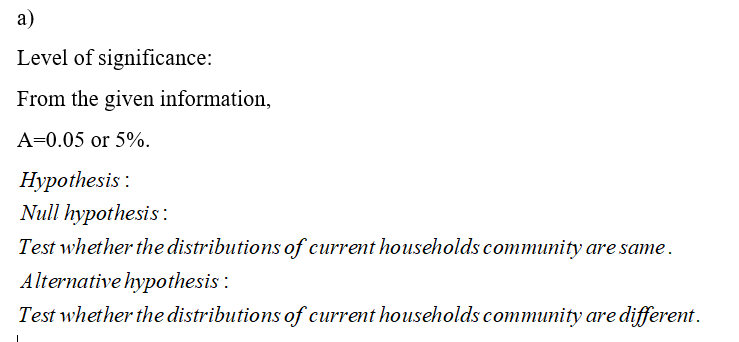
(a) What is the level of significance?
(b) Find the value of the chi-square statistic for the sample. (Round the expected frequencies to at least three decimal places. Round the test statistic to three decimal places.)
What are the degrees of freedom?
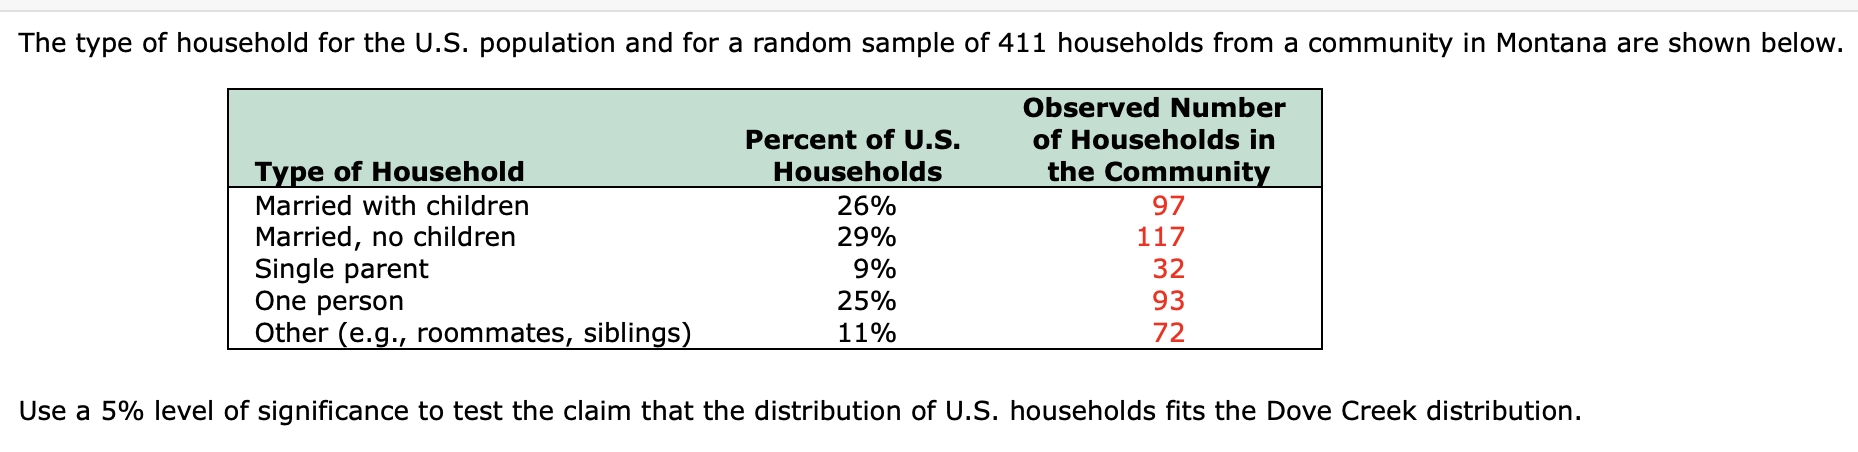
Transcribed Image Text:The type of household for the U.S. population and for a random sample of 411 households from a community in Montana are shown below.
Observed Number
Percent of U.S.
Type of Household
of Households in
the Community
Households
26%
29%
Married with children
Married, no children
Single parent
One person
Other (e.g., roommates, siblings)
97
117
9%
32
25%
93
11%
72
Use a 5% level of significance to test the claim that the distribution of U.S. households fits the Dove Creek distribution.
Expert Solution
Step 1
Step 2
b)
From the given data,
Expected frequency = n*Pi
Where, n is the sample size
Step 3
Step 4
From the above table,
The degrees of freedom = n-1
=5-1
=4

Step by step
Solved in 8 steps with 5 images

Knowledge Booster


Learn more about
Need a deep-dive on the concept behind this application? Look no further. Learn more about this topic, statistics and related others by exploring similar questions and additional content below.Recommended textbooks for you
Holt Mcdougal Larson Pre-algebra: Student Edition…
Algebra
ISBN:
9780547587776
Author:
HOLT MCDOUGAL
Publisher:
HOLT MCDOUGAL

College Algebra (MindTap Course List)
Algebra
ISBN:
9781305652231
Author:
R. David Gustafson, Jeff Hughes
Publisher:
Cengage Learning
Holt Mcdougal Larson Pre-algebra: Student Edition…
Algebra
ISBN:
9780547587776
Author:
HOLT MCDOUGAL
Publisher:
HOLT MCDOUGAL
College Algebra (MindTap Course List)
Algebra
ISBN:
9781305652231
Author:
R. David Gustafson, Jeff Hughes
Publisher:
Cengage Learning