Accountants at the Renong and Khalid Accountant Company believed that several traveling executives were submitting unusually high travel vouchers when they returned from business trips. First, they took a sample of 200 vouchers submitted from the past year. Then they developed the following multiple-regression equation relating expected travel cost (Y) to number of days on the road (X1) and distance travelled (X2) in miles:
Accountants at the Renong and Khalid Accountant Company believed that several traveling executives were submitting unusually high travel vouchers when they returned from business trips. First, they took a sample of 200 vouchers submitted from the past year. Then they developed the following multiple-regression equation relating expected travel cost (Y) to number of days on the road (X1) and distance travelled (X2) in miles:

Glencoe Algebra 1, Student Edition, 9780079039897, 0079039898, 2018
18th Edition
ISBN:9780079039897
Author:Carter
Publisher:Carter
Chapter4: Equations Of Linear Functions
Section4.6: Regression And Median-fit Lines
Problem 4GP

Related questions
Question
100%
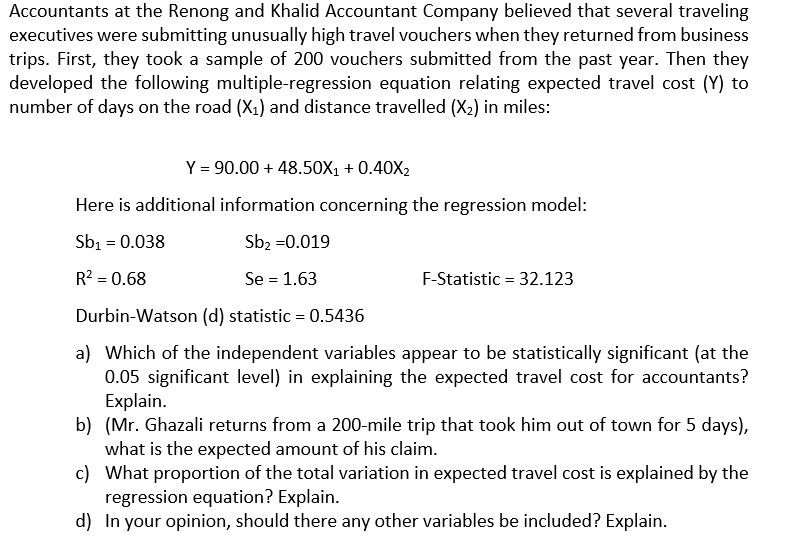
Transcribed Image Text:Accountants at the Renong and Khalid Accountant Company believed that several traveling
executives were submitting unusually high travel vouchers when they returned from business
trips. First, they took a sample of 200 vouchers submitted from the past year. Then they
developed the following multiple-regression equation relating expected travel cost (Y) to
number of days on the road (X1) and distance travelled (X2) in miles:
Y = 90.00 + 48.50X1 + 0.40X2
Here is additional information concerning the regression model:
Sb1 = 0.038
Sb2 =0.019
R? = 0.68
Se = 1.63
F-Statistic = 32.123
Durbin-Watson (d) statistic = 0.5436
a) Which of the independent variables appear to be statistically significant (at the
0.05 significant level) in explaining the expected travel cost for accountants?
Explain.
b) (Mr. Ghazali returns from a 200-mile trip that took him out of town for 5 days),
what is the expected amount of his claim.
c) What proportion of the total variation in expected travel cost is explained by the
regression equation? Explain.
d) In your opinion, should there any other variables be included? Explain.
Expert Solution
This question has been solved!
Explore an expertly crafted, step-by-step solution for a thorough understanding of key concepts.

Step by step
Solved in 6 steps

Recommended textbooks for you
Glencoe Algebra 1, Student Edition, 9780079039897…
Algebra
ISBN:
9780079039897
Author:
Carter
Publisher:
McGraw Hill

Functions and Change: A Modeling Approach to Coll…
Algebra
ISBN:
9781337111348
Author:
Bruce Crauder, Benny Evans, Alan Noell
Publisher:
Cengage Learning
Glencoe Algebra 1, Student Edition, 9780079039897…
Algebra
ISBN:
9780079039897
Author:
Carter
Publisher:
McGraw Hill
Functions and Change: A Modeling Approach to Coll…
Algebra
ISBN:
9781337111348
Author:
Bruce Crauder, Benny Evans, Alan Noell
Publisher:
Cengage Learning