The world's population living in extreme poverty has declined linearly between the years 2005 and 2011. In 2005, the percentage of the world's population living in extreme poverty was 20.70% and in 2011, the percentage of the world's population living in extreme poverty was 13.70%. Determine a linear equation that models the world's population in extreme poverty, in percentage, as a function of years since 2005. What is the slope of this function, and what does it tell you in practical terms? Round your answer to the nearest hundredth (0.01). Om = -7.00. The world's population in extreme poverty decreased by 7 percent per year between the years 2005 and 2011. Om = 7.00. The world's population in extreme poverty increased by 7 percent per year between the years 2005 and 2011. Om = 1.17. The world's population in extreme poverty increased by 1.17 percent per year between the years 2005 and 2011. Om = -1.17. The world's population in extreme poverty decreased by 1.17 percent per year between the years 2005 and 2011.
The world's population living in extreme poverty has declined linearly between the years 2005 and 2011. In 2005, the percentage of the world's population living in extreme poverty was 20.70% and in 2011, the percentage of the world's population living in extreme poverty was 13.70%. Determine a linear equation that models the world's population in extreme poverty, in percentage, as a function of years since 2005. What is the slope of this function, and what does it tell you in practical terms? Round your answer to the nearest hundredth (0.01). Om = -7.00. The world's population in extreme poverty decreased by 7 percent per year between the years 2005 and 2011. Om = 7.00. The world's population in extreme poverty increased by 7 percent per year between the years 2005 and 2011. Om = 1.17. The world's population in extreme poverty increased by 1.17 percent per year between the years 2005 and 2011. Om = -1.17. The world's population in extreme poverty decreased by 1.17 percent per year between the years 2005 and 2011.

Chapter1: Introducing The Economic Way Of Thinking
Section1.A: Applying Graphics To Economics
Problem 1SQ

Related questions
Question
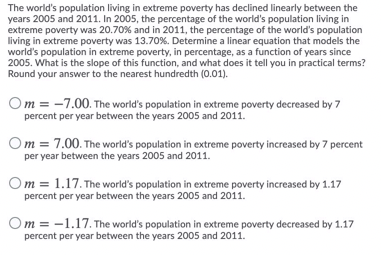
Transcribed Image Text:The world's population living in extreme poverty has declined linearly between the
years 2005 and 2011. In 2005, the percentage of the world's population living in
extreme poverty was 20.70% and in 2011, the percentage of the world's population
living in extreme poverty was 13.70%. Determine a linear equation that models the
world's population in extreme poverty, in percentage, as a function of years since
2005. What is the slope of this function, and what does it tell you in practical terms?
Round your answer to the nearest hundredth (0.01).
Om = -7.00. The world's population in extreme poverty decreased by 7
percent per year between the years 2005 and 2011.
Om = 7.00. The world's population in extreme poverty increased by 7 percent
per year between the years 2005 and 2011.
Om = 1.17. The world's population in extreme poverty increased by 1.17
percent per year between the years 2005 and 2011.
Om = -1.17. The world's population in extreme poverty decreased by 1.17
percent per year between the years 2005 and 2011.
Expert Solution
This question has been solved!
Explore an expertly crafted, step-by-step solution for a thorough understanding of key concepts.

Step by step
Solved in 2 steps

Knowledge Booster


Learn more about
Need a deep-dive on the concept behind this application? Look no further. Learn more about this topic, economics and related others by exploring similar questions and additional content below.Recommended textbooks for you


