There are four newly hired salespersons at Honda Cars Taguig Branch. The number of motorcycles sold by each newly hired salesperson last month is 4.5, 8, and9. a. Complete the information needed in the table below. b. How many samples of size 2 are possible? c. List all possible samples of size 2. Observation Sample
There are four newly hired salespersons at Honda Cars Taguig Branch. The number of motorcycles sold by each newly hired salesperson last month is 4.5, 8, and9. a. Complete the information needed in the table below. b. How many samples of size 2 are possible? c. List all possible samples of size 2. Observation Sample

MATLAB: An Introduction with Applications
6th Edition
ISBN:9781119256830
Author:Amos Gilat
Publisher:Amos Gilat
Chapter1: Starting With Matlab
Section: Chapter Questions
Problem 1P

Related questions
Topic Video
Question
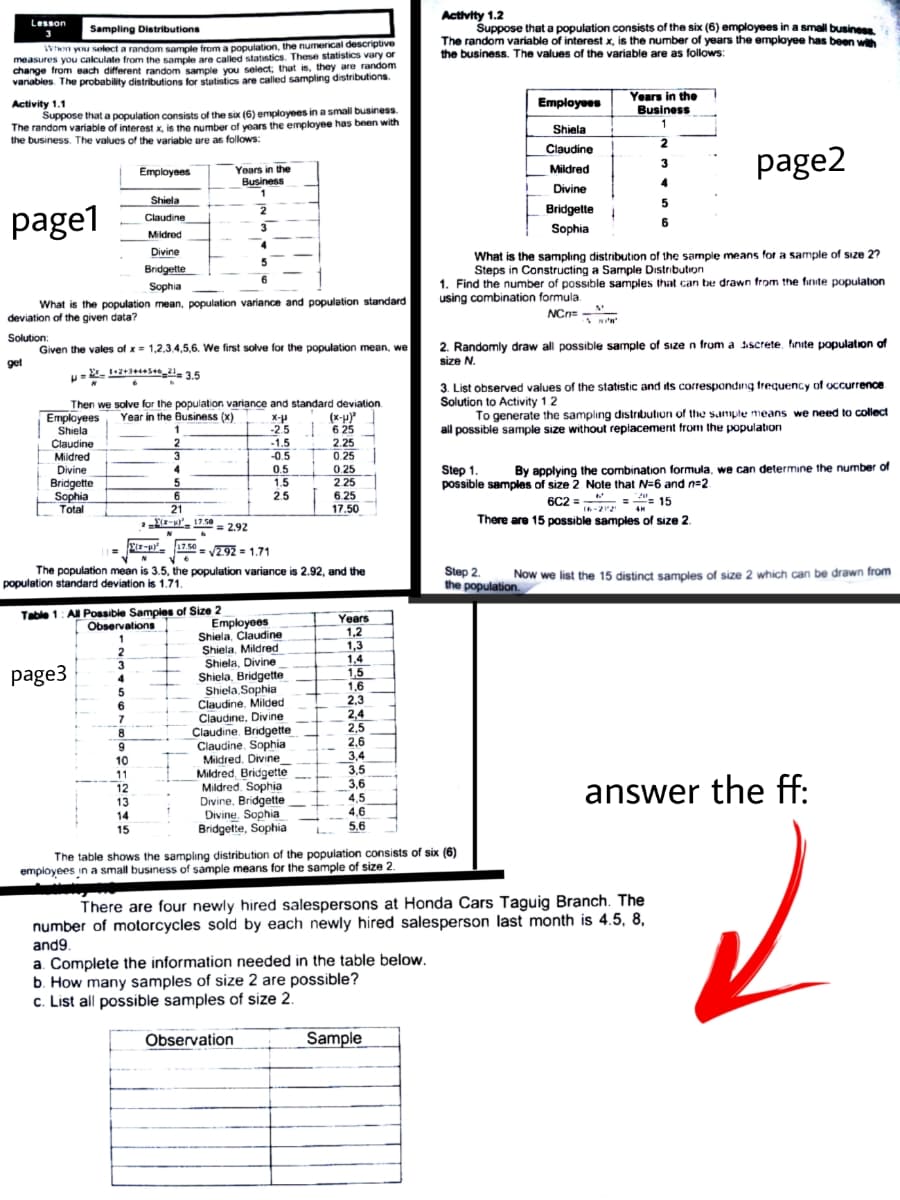
Transcribed Image Text:Activity 1.2
Suppose that a population consists of the six (6) employees in a small business
The random variable of interest x, is the number of years the employee has been wih
the business. The values of the variable are as follows:
Lesson
Sampling Distributions
WN you select a random sample from a population, the numerical descriptive
measures you calculate from the sample are called statistics. These statistics vary or
change from each different random sample you select, that is, they are random
variables. The probability distributions for statistics are called sampling distributions.
Years in the
Business
1
Employees
Activity 1.1
Suppose that a population consists of the six (6) employees in a small business.
The random variable of interest x, is the number of years the employee has been with
the business. The values of the variable are as follows:
Shiela
2
Claudine
page2
3
Mildred
Employees
Years in the
Business
4
Divine
Shiela
5
Bridgette i
page1
Claudine
3
Sophia
Mildred
Divine
What is the sampling distribution of the saạmple means for a sample of sıze 27
Steps in Constructing a Sample Distribution
Bridgette
1. Find the number of possible samples that can be drawn from the finte population
using combination formula.
Sophia
What is the population mean, population variance and population standard
deviation of the given data?
NCn=
Solution:
Given the vales of x = 1,2,3.4,5,6. We first solve for the population mean, we
get
2. Randomly draw all possible sample of sıze n from a iscrete, hnite population of
size N.
Then we solve for the population variance and standard deviation
Employees
| Shiela
Claudine
Mildred
3. List observed values of the statistic and its corresponding trequency of occurrence
Solution to Activity 12
To generate the sampling distribulion of the sample means we need to collect
all possible sample sıze without replacement from the population
Year in the Business (x)
X-p
-2.5
-1.5
-0.5
(x-p)
6 25
2.25
3
0.25
Divine
Bridgette
Sophia
Step 1.
possible samples of size 2 Note that N=6 and n=2
4.
0.5
0.25
By applying the combination formula, we can determine the number of
1.5
2.5
2.25
6.25
6.
6C2 =-"
2"= 15
Total
21
17.50
(-u. 17.5e
There are 15 possible samples of size 2.
" = 2.92
r-u. - 292 = 1.71
17.50
The population mean is 3.5, the population variance is 2.92, and the
population standard deviation is 1.71.
Step 2.
the population.
Now we list the 15 distinct samples of size 2 which can be drawn from
Table 1: A Possible Samples of Size 2
Observations
Years
1,2
1,3
1,4
Employees
Shiela, Claudine
Shiela, Mildred
Shiela, Divine
Shiela, Bridgette
Shiela, Sophia
Claudine, Milded
Claudine, Divine
Claudine. Bridgette
Claudine. Sophia
Mildred. Divine
Mildred, Bridgette
Mildred. Sophia
Divine. Bridgette
Divine. Sophia
Bridgette, Sophia
page3
3
4
1,5
1,6
2,3
2,4
2,5
2,6
3,4
3,5
3,6
4,5
4,6
5.6
7
8
6.
10
11
12
13
14
answer the ff:
15
The table shows the sampling distribution of the population consists of six (6)
employees in a small business of sample means for the sample of size 2.
There are four newly hired salespersons at Honda Cars Taguig Branch. The
number of motorcycles sold by each newly hired salesperson last month is 4.5, 8,
and9.
a. Complete the information needed in the table below.
b. How many samples of size 2 are possible?
c. List all possible samples of size 2.
Observation
Sample
Expert Solution
This question has been solved!
Explore an expertly crafted, step-by-step solution for a thorough understanding of key concepts.

Step by step
Solved in 3 steps

Knowledge Booster


Learn more about
Need a deep-dive on the concept behind this application? Look no further. Learn more about this topic, statistics and related others by exploring similar questions and additional content below.Recommended textbooks for you
MATLAB: An Introduction with Applications
Statistics
ISBN:
9781119256830
Author:
Amos Gilat
Publisher:
John Wiley & Sons Inc

Probability and Statistics for Engineering and th…
Statistics
ISBN:
9781305251809
Author:
Jay L. Devore
Publisher:
Cengage Learning

Statistics for The Behavioral Sciences (MindTap C…
Statistics
ISBN:
9781305504912
Author:
Frederick J Gravetter, Larry B. Wallnau
Publisher:
Cengage Learning
MATLAB: An Introduction with Applications
Statistics
ISBN:
9781119256830
Author:
Amos Gilat
Publisher:
John Wiley & Sons Inc
Probability and Statistics for Engineering and th…
Statistics
ISBN:
9781305251809
Author:
Jay L. Devore
Publisher:
Cengage Learning
Statistics for The Behavioral Sciences (MindTap C…
Statistics
ISBN:
9781305504912
Author:
Frederick J Gravetter, Larry B. Wallnau
Publisher:
Cengage Learning

Elementary Statistics: Picturing the World (7th E…
Statistics
ISBN:
9780134683416
Author:
Ron Larson, Betsy Farber
Publisher:
PEARSON

The Basic Practice of Statistics
Statistics
ISBN:
9781319042578
Author:
David S. Moore, William I. Notz, Michael A. Fligner
Publisher:
W. H. Freeman

Introduction to the Practice of Statistics
Statistics
ISBN:
9781319013387
Author:
David S. Moore, George P. McCabe, Bruce A. Craig
Publisher:
W. H. Freeman