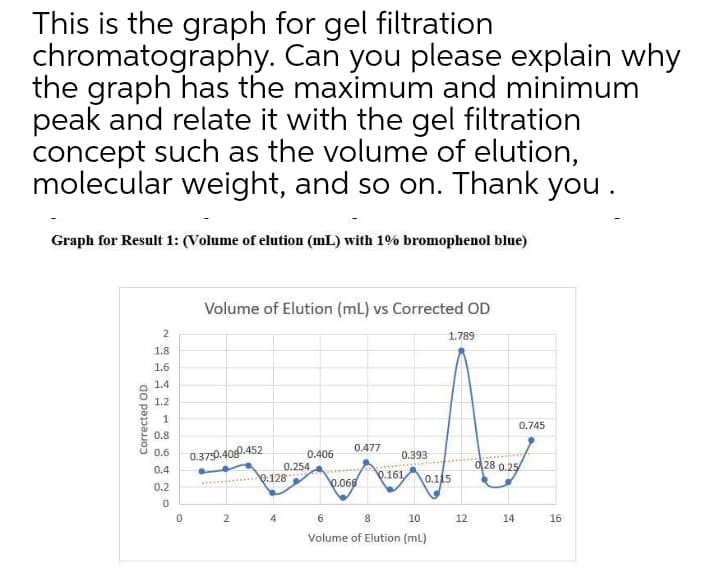
This is the graph for gel filtration chromatography. Can you please explain why the graph has the maximum and minimum peak and relate it with the gel filtration concept such as the volume of elution, molecular weight, and so on. Thank you .
This is the graph for gel filtration chromatography. Can you please explain why the graph has the maximum and minimum peak and relate it with the gel filtration concept such as the volume of elution, molecular weight, and so on. Thank you .

Chapter31: Introduction To Analytical Separations
Section: Chapter Questions
Problem 31.23QAP

Related questions
Question
Transcribed Image Text:This is the graph for gel filtration
chromatography. Can you please explain why
the graph has the maximum and minimum
peak and relate it with the gel filtration
concept such as the volume of elution,
molecular weight, and so on. Thank you .
Graph for Result 1: (Volume of elution (mL) with 1% bromophenol blue)
Volume of Elution (mL) vs Corrected OD
1.789
1.8
1.6
1.4
1.2
0.745
0.8
0.477
0.6
0.379.400.452
0.406
0.393
0.254
d28 0.25
0.4
9:128
0.161
0.115
0.2
0.060
2
6.
10
12
14
16
Volume of Elution (mL)
Corrected OD
Expert Solution
This question has been solved!
Explore an expertly crafted, step-by-step solution for a thorough understanding of key concepts.

This is a popular solution!

Trending now
This is a popular solution!

Step by step
Solved in 2 steps with 1 images

Knowledge Booster


Learn more about
Need a deep-dive on the concept behind this application? Look no further. Learn more about this topic, chemistry and related others by exploring similar questions and additional content below.Recommended textbooks for you

Principles of Instrumental Analysis
Chemistry
ISBN:
9781305577213
Author:
Douglas A. Skoog, F. James Holler, Stanley R. Crouch
Publisher:
Cengage Learning
Principles of Instrumental Analysis
Chemistry
ISBN:
9781305577213
Author:
Douglas A. Skoog, F. James Holler, Stanley R. Crouch
Publisher:
Cengage Learning

Macroscale and Microscale Organic Experiments
Chemistry
ISBN:
9781305577190
Author:
Kenneth L. Williamson, Katherine M. Masters
Publisher:
Brooks Cole

EBK A SMALL SCALE APPROACH TO ORGANIC L
Chemistry
ISBN:
9781305446021
Author:
Lampman
Publisher:
CENGAGE LEARNING - CONSIGNMENT