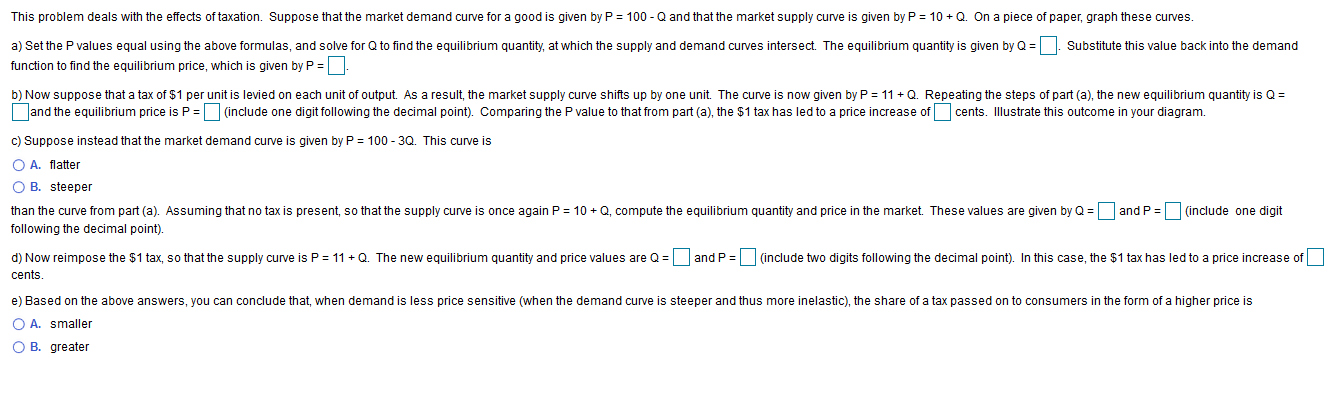
This problem deals with the effects of taxation. Suppose that the market demand curve for a good is given by P 100 Q and that the market supply curve is given by P 10Q On a piece of paper, graph these curves. a) Set the P values equal using the above formulas, and solve for Q to find the equilibrium quantity, at which the supply and demand curves intersect. The equilibrium quantity is given by Q Substitute this value back into the demand function to find the equilibrium price, which is given by P . b) Now suppose that a tax of $1 per unit is levied on each unit of output. As a result, the market supply curve shifts up by one unit. The curve is now given by P = 11 Q Repeating the steps of part (a), the new equilibrium quantity is Q and the equilibrium price is P (include one digit following the decimal point). Comparing the P value to that from part (a), the $1 tax has led to a price increase of cents. Illustrate this outcome in your diagram. c) Suppose instead that the market demand curve is given by P = 100 - 3Q. This curve is O A. flatter O B. steeper than the curve from part (a). Assuming that no tax is present, so that the supply curve is once again P 10 Q, compute the equilibrium quantity and price in the market. These values are given by Q and P (include one digit following the decimal point). d) Now reimpose the $1 tax, so that the supply curve is P (include two digits following the decimal point). In this case, the $1 tax has led to a price increase of and P 11 Q. The new equilibrium quantity and price values are Q cents. e) Based on the above answers, you can conclude that, when demand is less price sensitive (when the demand curve is steeper and thus more inelastic), the share of a tax passed on to consumers in the form of a higher price is O A. smaller O B. greater
This problem deals with the effects of taxation. Suppose that the market demand curve for a good is given by P 100 Q and that the market supply curve is given by P 10Q On a piece of paper, graph these curves. a) Set the P values equal using the above formulas, and solve for Q to find the equilibrium quantity, at which the supply and demand curves intersect. The equilibrium quantity is given by Q Substitute this value back into the demand function to find the equilibrium price, which is given by P . b) Now suppose that a tax of $1 per unit is levied on each unit of output. As a result, the market supply curve shifts up by one unit. The curve is now given by P = 11 Q Repeating the steps of part (a), the new equilibrium quantity is Q and the equilibrium price is P (include one digit following the decimal point). Comparing the P value to that from part (a), the $1 tax has led to a price increase of cents. Illustrate this outcome in your diagram. c) Suppose instead that the market demand curve is given by P = 100 - 3Q. This curve is O A. flatter O B. steeper than the curve from part (a). Assuming that no tax is present, so that the supply curve is once again P 10 Q, compute the equilibrium quantity and price in the market. These values are given by Q and P (include one digit following the decimal point). d) Now reimpose the $1 tax, so that the supply curve is P (include two digits following the decimal point). In this case, the $1 tax has led to a price increase of and P 11 Q. The new equilibrium quantity and price values are Q cents. e) Based on the above answers, you can conclude that, when demand is less price sensitive (when the demand curve is steeper and thus more inelastic), the share of a tax passed on to consumers in the form of a higher price is O A. smaller O B. greater

Microeconomics: Principles & Policy
14th Edition
ISBN:9781337794992
Author:William J. Baumol, Alan S. Blinder, John L. Solow
Publisher:William J. Baumol, Alan S. Blinder, John L. Solow
Chapter17: Taxation And Resource Allocation
Section: Chapter Questions
Problem 4TY

Related questions

Question
Part a, b, c
Transcribed Image Text:This problem deals with the effects of taxation. Suppose that the market demand curve for a good is given by P
100 Q and that the market supply curve is given by P
10Q
On a piece of paper, graph these curves.
a) Set the P values equal using the above formulas, and solve for Q to find the equilibrium quantity, at which the supply and demand curves intersect. The equilibrium quantity is given by Q
Substitute this value back into the demand
function to find the equilibrium price, which is given by P .
b) Now suppose that a tax of $1 per unit is levied on each unit of output. As a result, the market supply curve shifts up by one unit. The curve is now given by P = 11 Q
Repeating the steps of part (a), the new equilibrium quantity is Q
and the equilibrium price is P (include one digit following the decimal point). Comparing the P value to that from part (a), the $1 tax has led to a price increase of
cents. Illustrate this outcome in your diagram.
c) Suppose instead that the market demand curve is given by P = 100 - 3Q. This curve is
O A. flatter
O B. steeper
than the curve from part (a). Assuming that no tax is present, so that the supply curve is once again P 10 Q, compute the equilibrium quantity and price in the market. These values are given by Q
and P (include one digit
following the decimal point).
d) Now reimpose the $1 tax, so that the supply curve is P
(include two digits following the decimal point). In this case, the $1 tax has led to a price increase of
and P
11 Q. The new equilibrium quantity and price values are Q
cents.
e) Based on the above answers, you can conclude that, when demand is less price sensitive (when the demand curve is steeper and thus more inelastic), the share of a tax passed on to consumers in the form of a higher price is
O A. smaller
O B. greater
Expert Solution
This question has been solved!
Explore an expertly crafted, step-by-step solution for a thorough understanding of key concepts.

This is a popular solution!

Trending now
This is a popular solution!

Step by step
Solved in 8 steps with 7 images

Knowledge Booster


Learn more about
Need a deep-dive on the concept behind this application? Look no further. Learn more about this topic, economics and related others by exploring similar questions and additional content below.Recommended textbooks for you
Microeconomics: Principles & Policy
Economics
ISBN:
9781337794992
Author:
William J. Baumol, Alan S. Blinder, John L. Solow
Publisher:
Cengage Learning

Principles of Microeconomics
Economics
ISBN:
9781305156050
Author:
N. Gregory Mankiw
Publisher:
Cengage Learning

Microeconomics: Principles & Policy
Economics
ISBN:
9781337794992
Author:
William J. Baumol, Alan S. Blinder, John L. Solow
Publisher:
Cengage Learning
Principles of Microeconomics
Economics
ISBN:
9781305156050
Author:
N. Gregory Mankiw
Publisher:
Cengage Learning

Principles of Macroeconomics (MindTap Course List)
Economics
ISBN:
9781305971509
Author:
N. Gregory Mankiw
Publisher:
Cengage Learning

Principles of Microeconomics (MindTap Course List)
Economics
ISBN:
9781305971493
Author:
N. Gregory Mankiw
Publisher:
Cengage Learning

Principles of Macroeconomics (MindTap Course List)
Economics
ISBN:
9781285165912
Author:
N. Gregory Mankiw
Publisher:
Cengage Learning