Government-imposed taxes cause reductions in the activity that is being taxed, which has important implications for revenue collections. To understand the effect of such a tax, consider the monthly market for cigarettes, which is shown on the following graph. Use the graph input tool to help you answer the following questions. You will not be graded on any changes you make to this graph. Note: Once you enter a value in a white field, the graph and any corresponding amounts in each grey field will change accordingly. Graph Input Tool Market for Cigarettes 20 I Quantity (Packs) 56 18 Supply Demand Price (Dollars per pack) Supply Price (Dollars per pack) 16 12.00 8.00 14 Таx (Dollars per pack) 4.00 12 10 8 Demand 4 2 14 28 42 56 70 84 98 112 126 140 QUANTITY (Packs) Suppose the government imposes a $4-per-pack tax on suppliers. At this tax amount, the equilibrium quantity of cigarettes is packs, and the government collects $ in tax revenue. Now calculate the government's tax revenue if it sets a tax of $0, $4, $8, $10, $12, $16, or $20 per pack. (Hint: To find the equilibrium quantity after the tax, adjust the "Quantity" field until the Tax equals the value of the per-unit tax.) Using the data you generate, plot a Laffer curve by using the green points (triangle symbol) to plot total tax revenue at each of those tax levels. Note: Plot your points in the order in which you would like them connected. Line segments will connect the points automatically. PRICE (Dollars per pack)
Government-imposed taxes cause reductions in the activity that is being taxed, which has important implications for revenue collections. To understand the effect of such a tax, consider the monthly market for cigarettes, which is shown on the following graph. Use the graph input tool to help you answer the following questions. You will not be graded on any changes you make to this graph. Note: Once you enter a value in a white field, the graph and any corresponding amounts in each grey field will change accordingly. Graph Input Tool Market for Cigarettes 20 I Quantity (Packs) 56 18 Supply Demand Price (Dollars per pack) Supply Price (Dollars per pack) 16 12.00 8.00 14 Таx (Dollars per pack) 4.00 12 10 8 Demand 4 2 14 28 42 56 70 84 98 112 126 140 QUANTITY (Packs) Suppose the government imposes a $4-per-pack tax on suppliers. At this tax amount, the equilibrium quantity of cigarettes is packs, and the government collects $ in tax revenue. Now calculate the government's tax revenue if it sets a tax of $0, $4, $8, $10, $12, $16, or $20 per pack. (Hint: To find the equilibrium quantity after the tax, adjust the "Quantity" field until the Tax equals the value of the per-unit tax.) Using the data you generate, plot a Laffer curve by using the green points (triangle symbol) to plot total tax revenue at each of those tax levels. Note: Plot your points in the order in which you would like them connected. Line segments will connect the points automatically. PRICE (Dollars per pack)

Chapter1: Making Economics Decisions
Section: Chapter Questions
Problem 1QTC

Related questions
Question
I need help with HW.
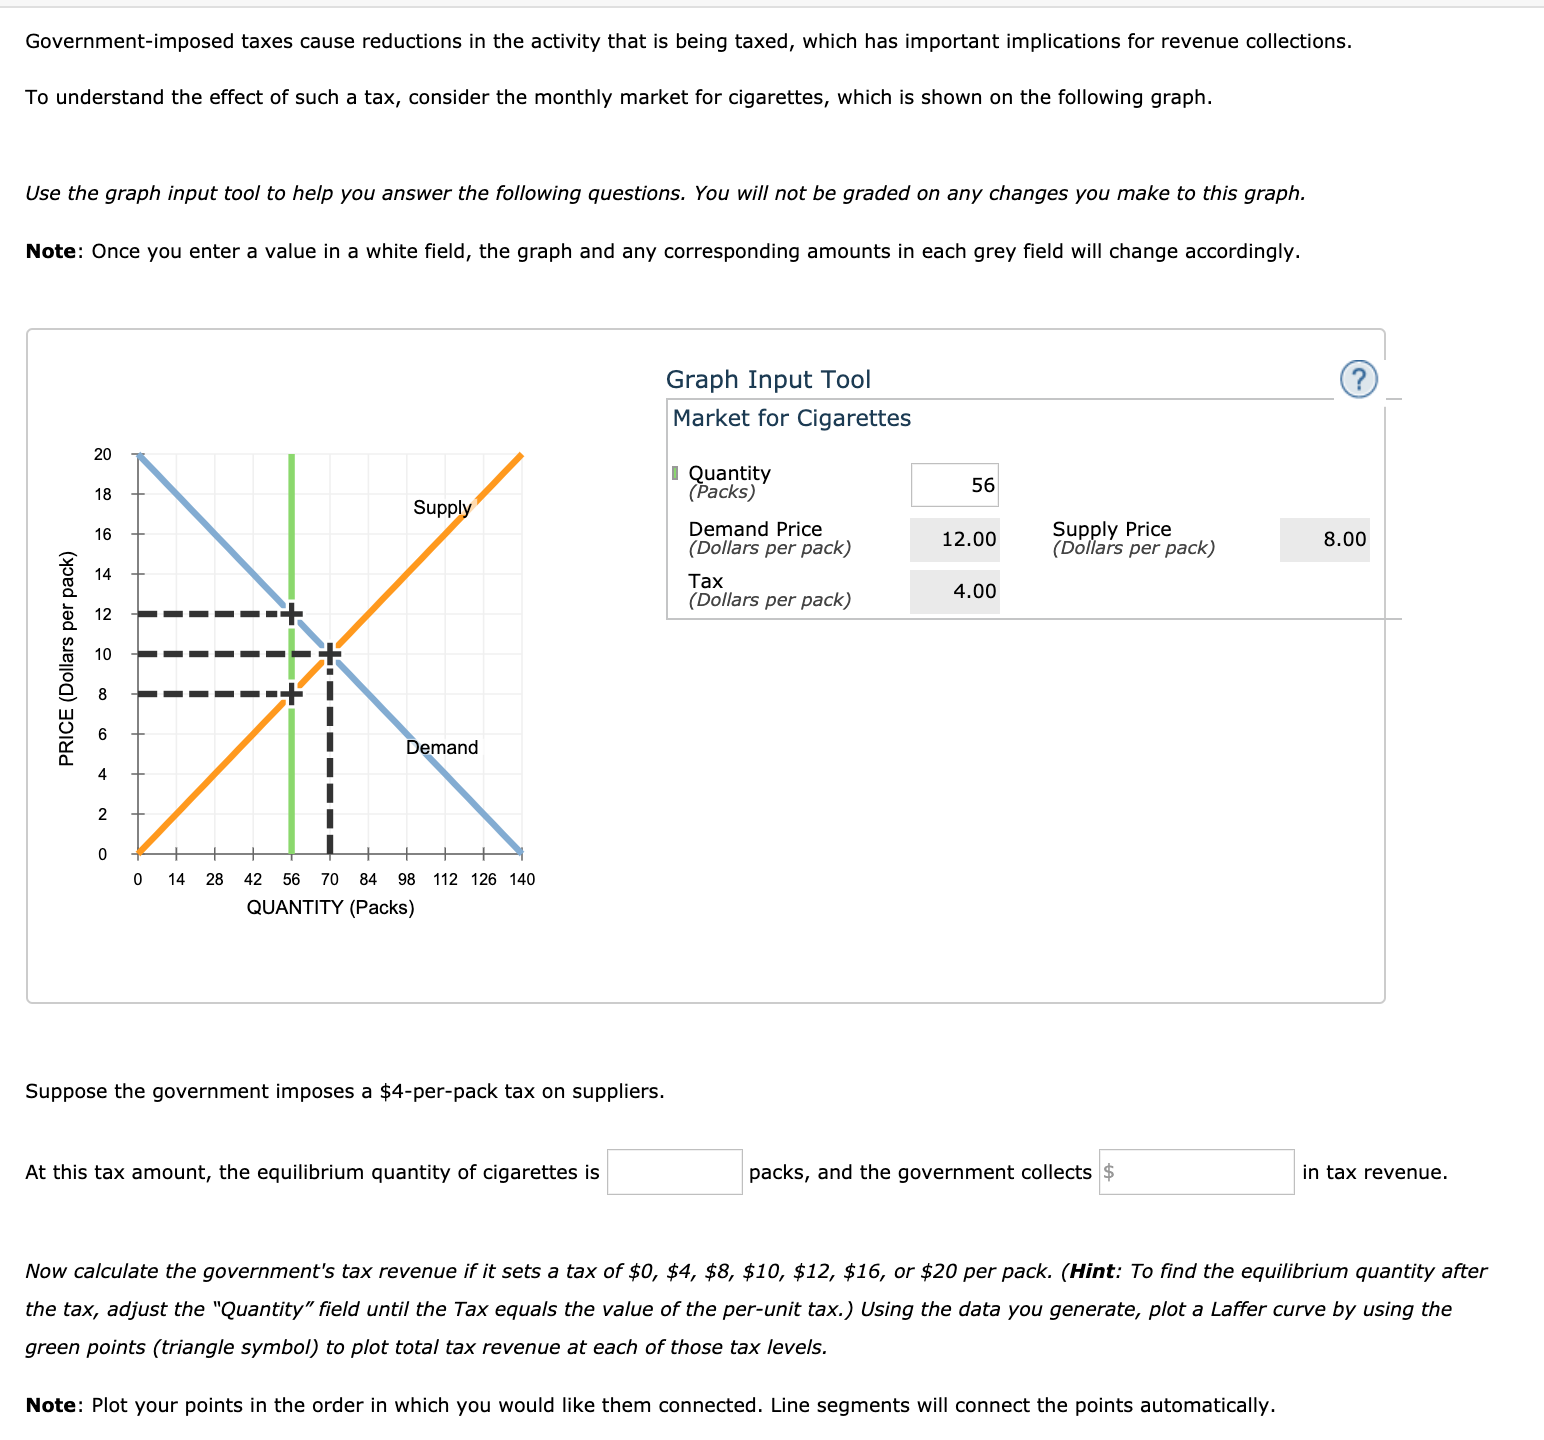
Transcribed Image Text:Government-imposed taxes cause reductions in the activity that is being taxed, which has important implications for revenue collections.
To understand the effect of such a tax, consider the monthly market for cigarettes, which is shown on the following graph.
Use the graph input tool to help you answer the following questions. You will not be graded on any changes you make to this graph.
Note: Once you enter a value in a white field, the graph and any corresponding amounts in each grey field will change accordingly.
Graph Input Tool
Market for Cigarettes
20
I Quantity
(Packs)
56
18
Supply
Demand Price
(Dollars per pack)
Supply Price
(Dollars per pack)
16
12.00
8.00
14
Таx
(Dollars per pack)
4.00
12
10
8
Demand
4
2
14
28
42 56
70
84
98 112 126 140
QUANTITY (Packs)
Suppose the government imposes a $4-per-pack tax on suppliers.
At this tax amount, the equilibrium quantity of cigarettes is
packs, and the government collects $
in tax revenue.
Now calculate the government's tax revenue if it sets a tax of $0, $4, $8, $10, $12, $16, or $20 per pack. (Hint: To find the equilibrium quantity after
the tax, adjust the "Quantity" field until the Tax equals the value of the per-unit tax.) Using the data you generate, plot a Laffer curve by using the
green points (triangle symbol) to plot total tax revenue at each of those tax levels.
Note: Plot your points in the order in which you would like them connected. Line segments will connect the points automatically.
PRICE (Dollars per pack)

Expert Solution
This question has been solved!
Explore an expertly crafted, step-by-step solution for a thorough understanding of key concepts.

This is a popular solution!

Trending now
This is a popular solution!

Step by step
Solved in 2 steps

Knowledge Booster


Learn more about
Need a deep-dive on the concept behind this application? Look no further. Learn more about this topic, economics and related others by exploring similar questions and additional content below.Recommended textbooks for you

Principles of Economics (12th Edition)
Economics
ISBN:
9780134078779
Author:
Karl E. Case, Ray C. Fair, Sharon E. Oster
Publisher:
PEARSON

Engineering Economy (17th Edition)
Economics
ISBN:
9780134870069
Author:
William G. Sullivan, Elin M. Wicks, C. Patrick Koelling
Publisher:
PEARSON
Principles of Economics (12th Edition)
Economics
ISBN:
9780134078779
Author:
Karl E. Case, Ray C. Fair, Sharon E. Oster
Publisher:
PEARSON
Engineering Economy (17th Edition)
Economics
ISBN:
9780134870069
Author:
William G. Sullivan, Elin M. Wicks, C. Patrick Koelling
Publisher:
PEARSON

Principles of Economics (MindTap Course List)
Economics
ISBN:
9781305585126
Author:
N. Gregory Mankiw
Publisher:
Cengage Learning

Managerial Economics: A Problem Solving Approach
Economics
ISBN:
9781337106665
Author:
Luke M. Froeb, Brian T. McCann, Michael R. Ward, Mike Shor
Publisher:
Cengage Learning

Managerial Economics & Business Strategy (Mcgraw-…
Economics
ISBN:
9781259290619
Author:
Michael Baye, Jeff Prince
Publisher:
McGraw-Hill Education