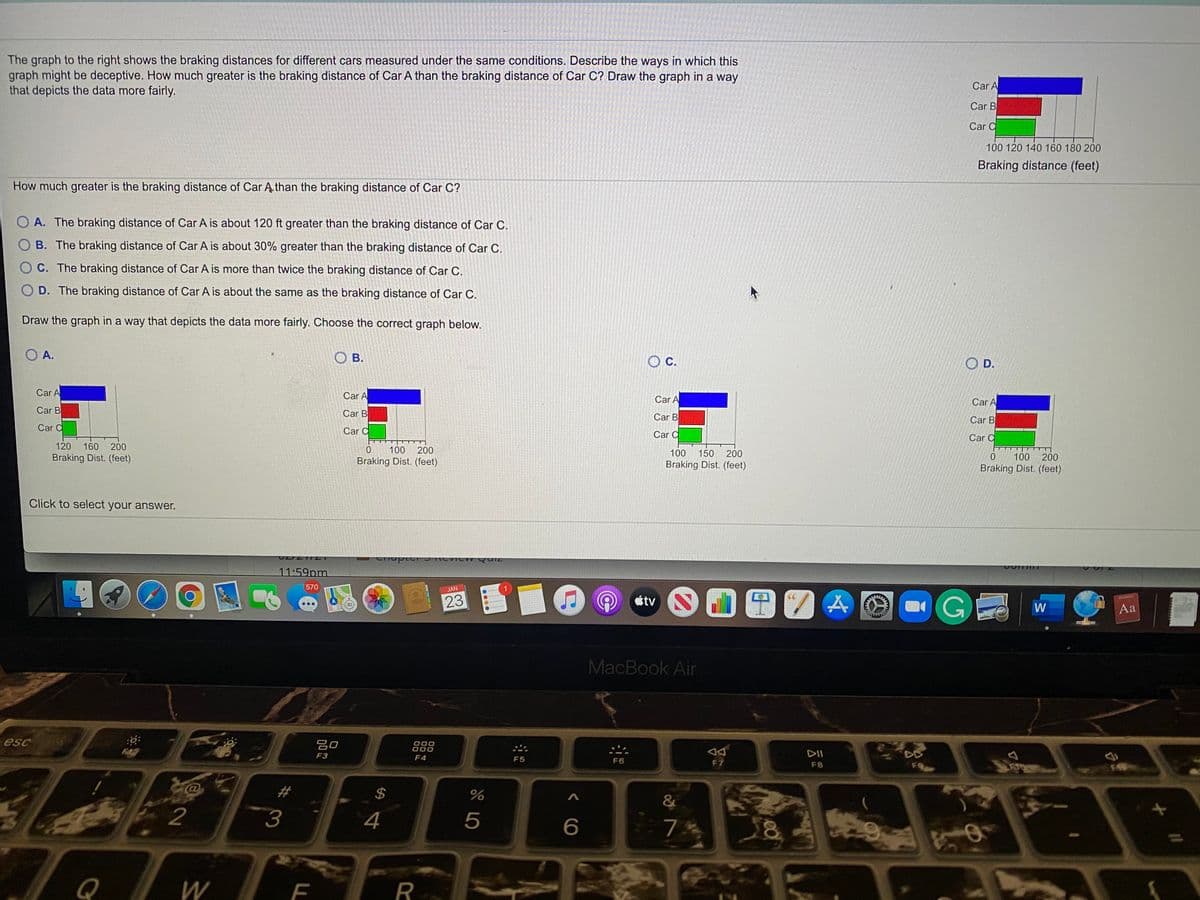
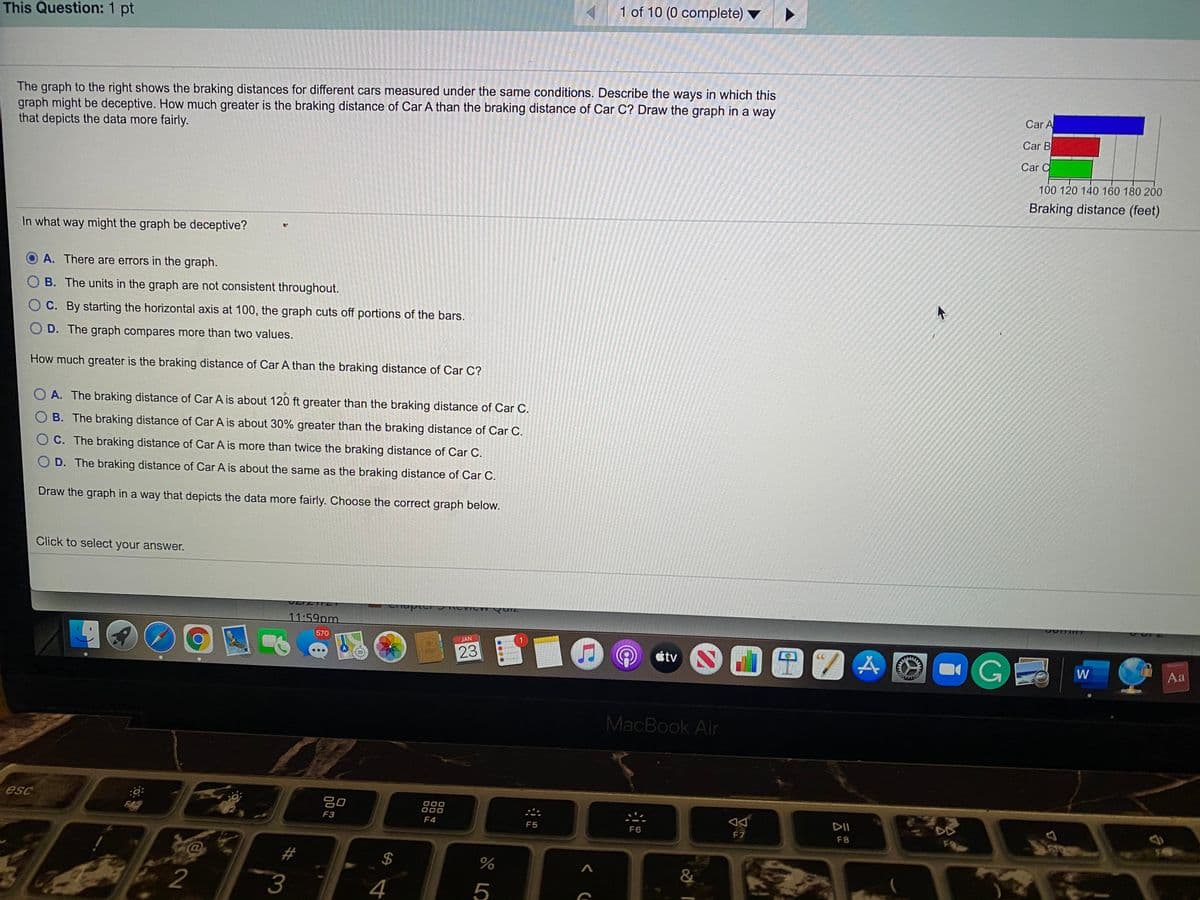
This Question: 1 pt 1 of 10 (0 complete) ▼ The graph to the right shows the braking distances for different cars measured under the same conditions. Describe the ways in which this graph might be deceptive. How much greater is the braking distance of Car A than the braking distance of Car C? Draw the graph in a way that depicts the data more fairly. Car A Car B Car C 100 120 140 160 180 200 Braking distance (feet) In what way might the graph be deceptive? O A. There are errors in the graph. O B. The units in the graph are not consistent throughout. O C. By starting the horizontal axis at 100, the graph cuts off portions of the bars. O D. The graph compares more than two values. How much greater is the braking distance of Car A than the braking distance of Car C? O A. The braking distance of Car A is about 120 ft greater than the braking distance of Car C. OB. The braking distance of Car A is about 30% greater than the braking distance of Car C. O C. The braking distance of Car A is more than twice the braking distance of Car C. The braking distance of Car A is about the same as the braking distance of Car C. Draw the graph in a way that depicts the data more fairly. Choose the correct graph below. Click to select your answer.

Mathematics For Machine Technology
8th Edition
ISBN:9781337798310
Author:Peterson, John.
Publisher:Peterson, John.
Chapter29: Tolerance, Clearance, And Interference
Section: Chapter Questions
Problem 12A
icon
Related questions
icon
Concept explainers
Topic Video
Question

The graph to the right shows the braking distances for different cars measured under the same conditions. Describe the ways in which this graph might be deceptive. How much greater is the braking distance of Car A than the braking distance of Car​ C? Draw the graph in a way that depicts the data more fairly.

In what way might the graph be​ deceptive?
 
 
A.
There are errors in the graph.
 
B.
The units in the graph are not consistent throughout.
 
C.
By starting the horizontal axis at​ 100, the graph cuts off portions of the bars.
 
D.
The graph compares more than two values.


How much greater is the braking distance of Car A than the braking distance of Car​ C?
 
 
A.
The braking distance of Car A is about 120 ft greater than the braking distance of Car C.
 
B.
The braking distance of Car A is about
30​%
greater than the braking distance of Car C.
 
C.
The braking distance of Car A is more than twice the braking distance of Car C.
 
D.
The braking distance of Car A is about the same as the braking distance of Car C.
The graph to the right shows the braking distances for different cars measured under the same conditions. Describe the ways in which this
graph might be deceptive. How much greater is the braking distance of Car A than the braking distance of Car C? Draw the graph in a way
that depicts the data more fairly.
Car A
Car B
Car C
100 120 140 160 180 200
Braking distance (feet)
How much greater is the braking distance of Car Ą than the braking distance of Car C?
O A. The braking distance of Car A is about 120 ft greater than the braking distance of Car C.
O B. The braking distance of Car A is about 30% greater than the braking distance of Car C.
O C. The braking distance of Car A is more than twice the braking distance of Car C.
O D. The braking distance of Car A is about the same as the braking distance of Car C.
Draw the graph in a way that depicts the data more fairly. Choose the correct graph below.
O A.
O B.
C.
O D.
Car A
Car A
Car A
Car A
Car B
Car B
Car B
Car B
Car C
Car C
Car C
Car C
120
160 200
100
200
Braking Dist. (feet)
100
150 200
100
200
Braking Dist. (feet)
Click to select your answer.
erhupter J CVIC wQuiz
11:59pm
570
JAN
OGE
23
tv
Di y
W
Aa
MacBook Air
esc
吕口
000
DII
DE
F3
F4
F5
F6
F7
F8
2$
&
2
3
4
5
6
Q
R
F.
Transcribed Image Text:The graph to the right shows the braking distances for different cars measured under the same conditions. Describe the ways in which this graph might be deceptive. How much greater is the braking distance of Car A than the braking distance of Car C? Draw the graph in a way that depicts the data more fairly. Car A Car B Car C 100 120 140 160 180 200 Braking distance (feet) How much greater is the braking distance of Car Ą than the braking distance of Car C? O A. The braking distance of Car A is about 120 ft greater than the braking distance of Car C. O B. The braking distance of Car A is about 30% greater than the braking distance of Car C. O C. The braking distance of Car A is more than twice the braking distance of Car C. O D. The braking distance of Car A is about the same as the braking distance of Car C. Draw the graph in a way that depicts the data more fairly. Choose the correct graph below. O A. O B. C. O D. Car A Car A Car A Car A Car B Car B Car B Car B Car C Car C Car C Car C 120 160 200 100 200 Braking Dist. (feet) 100 150 200 100 200 Braking Dist. (feet) Braking Dist. (feet) Braking Dist. (feet) Click to select your answer. erhupter J CVIC wQuiz 11:59pm 570 JAN OGE 23 tv Di y W Aa MacBook Air esc 吕口 000 DII DE F3 F4 F5 F6 F7 F8 2$ & 2 3 4 5 6 Q R F.
1 of 10 (0 complete)
This Question: 1 pt
The graph to the right shows the braking distances for different cars measured under the same conditions. Describe the ways in which this
graph might be deceptive. How much greater is the braking distance of Car A than the braking distance of Car C? Draw the graph in a way
that depicts the data more fairly.
Car A
Car B
Car C
100 120 140 160 180 200
Braking distance (feet)
In what way might the graph be deceptive?
A. There are errors in the graph.
B. The units in the graph are not consistent throughout.
C. By starting the horizontal axis at 100, the graph cuts off portions of the bars.
O D. The graph compares more than two values.
How much greater is the braking distance of Car A than the braking distance of Car C?
O A. The braking distance of Car A is about 120 ft greater than the braking distance of Car C.
O B. The braking distance of Car A is about 30% greater than the braking distance of Car C.
O C. The braking distance of Car A is more than twice the braking distance of Car C.
O D. The braking distance of Car A is about the same as the braking distance of Car C.
Draw the graph in a way that depicts the data more fairly. Choose the correct graph below.
Click to select your answer.
11:59pm
570
GE
JAN
23
étv
W
Aa
MacBook Air
esc
吕0
000
000
F42
DII
F3
F4
F5
F6
F7
F8
F9
2#
&
2
3
4
%24
Transcribed Image Text:1 of 10 (0 complete) This Question: 1 pt The graph to the right shows the braking distances for different cars measured under the same conditions. Describe the ways in which this graph might be deceptive. How much greater is the braking distance of Car A than the braking distance of Car C? Draw the graph in a way that depicts the data more fairly. Car A Car B Car C 100 120 140 160 180 200 Braking distance (feet) In what way might the graph be deceptive? A. There are errors in the graph. B. The units in the graph are not consistent throughout. C. By starting the horizontal axis at 100, the graph cuts off portions of the bars. O D. The graph compares more than two values. How much greater is the braking distance of Car A than the braking distance of Car C? O A. The braking distance of Car A is about 120 ft greater than the braking distance of Car C. O B. The braking distance of Car A is about 30% greater than the braking distance of Car C. O C. The braking distance of Car A is more than twice the braking distance of Car C. O D. The braking distance of Car A is about the same as the braking distance of Car C. Draw the graph in a way that depicts the data more fairly. Choose the correct graph below. Click to select your answer. 11:59pm 570 GE JAN 23 étv W Aa MacBook Air esc 吕0 000 000 F42 DII F3 F4 F5 F6 F7 F8 F9 2# & 2 3 4 %24
Expert Solution
trending now

Trending now

This is a popular solution!

steps

Step by step

Solved in 2 steps

Blurred answer
Knowledge Booster
Centre, Spread, and Shape of a Distribution
Learn more about
Need a deep-dive on the concept behind this application? Look no further. Learn more about this topic, statistics and related others by exploring similar questions and additional content below.
Recommended textbooks for you
Mathematics For Machine Technology
Advanced Math
ISBN:
9781337798310
Author:
Peterson, John.
Publisher:
Cengage Learning,
Algebra & Trigonometry with Analytic Geometry
Algebra
ISBN:
9781133382119
Author:
Swokowski
Publisher:
Cengage
College Algebra (MindTap Course List)
Algebra
ISBN:
9781305652231
Author:
R. David Gustafson, Jeff Hughes
Publisher:
Cengage Learning