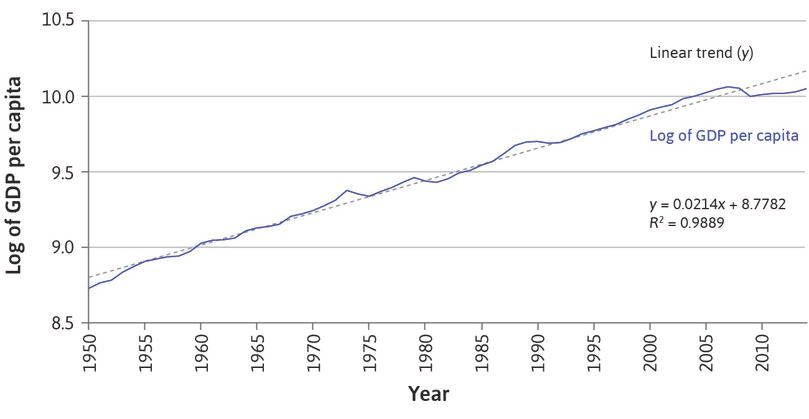
This shows log GDP per capita for the UK. Which of the following statements are correct? Select one or more: a. The graph shows that in 1950 UK GDP per capita was about £8.75. b. The trend growth rate over the period was 0.9889% per annum.


Q: Provide an interpretation for how labor hours is related to wage in the following: labor hours =…
A: given labor hours = -0.90+0.543 log ( wage) Here labor hours : dependent variable Wage :…
Q: Not long ago, a popular car magazine raced a Dodge Viper SRT- 10 on an airport runway to see how…
A:
Q: Find the exponential model that fits the points shown in the graph .
A: To find : Write an exponential function that passing through the points (3,10 ) and…
Q: Evaluate Logarithms (Level 3) Feb 24, 10:17:02 PM Watch help video
A:
Q: Median Rent as an Exponential function Years 2010 2019 2029(est) Median rent for All $2,090 $2,400…
A:
Q: log, (x – 1) – 5,
A: Let f(x)=log2(x-1)-5. Now f(2)=log2(2-1)-5=log2(1)-5=log2(20)-5=0-5=-5…
Q: Fit the exponential trend for the following data and find the trend values Year : 1958 1968 1978…
A:
Q: For the scatter plots, determine whether an exponential function, a logarithmic function,or a linear…
A:
Q: Is the natural logarithm function,often called the common logarithm function?
A: The natural logarithm function is y=ln(y)=loge(x) . This has base=e. The common logarithm function…
Q: b) A new variable was created from 'transforming' the AGT levels by computing the 'natural…
A: Examine the probability plot and assess how closely the data points follow the fitted distribution…
Q: Based on the scatterplot and computer output, a reasonable estimate for the stock price for week 95…
A: Given: An exponential model is created for estimating the stock price based on the number of weeks…
Q: Question #4 An administrator at a health care clinic needs to determine staffing levels. The…
A: Given: A healthcare clinic administrator must decide on personnel levels. The administrator has…
Q: For Exercises 35-38, a graph of data is given. From visual inspection, which model would best fit…
A: Consider the graph of the question 35. Find which model would best fit among: y=mx+b, y=abx, y=a+bln…
Q: The number of Twitter employees are shown in the table for various years. Let f(t) be the number of…
A: (b) Consider the general formula for the exponential function f(t) and use the data for the 1st 2…
Q: The pHpH scale for acidity is defined by pH=−log10[H+] where [H+] is the concentration of hydrogen…
A: A) We know that pH=−log [H + ] Given, pH=7 So, 7=−log [H +] log [H + ]=−7⟹[H+]=10-7 Hence, the…
Q: Use log4 15 = 1.953 and log4 34 2.544 to match each logarithm with its approximate value. log4 225…
A:
Q: Evaluate the following logarithm log32 + 3 logg2 + log316 2 1
A: To evaluate the given logarithm: log82+3log82+12log82
Q: Assuming that population growth is approximately exponential, which of the following two sets of…
A: Given that the population growth is approximately exponential . This implies the ratio of population…
Q: For item number 6-7, refer to the graph below: 6 What is the domain of the exponential function? a.…
A: Since, the domain is the set of all values of the independent variable x for which exp(x) exists…
Q: Given the following exponential function, identify whether the change represents growth or decay,…
A: Given function y = 590 (1.061)x is exponential function. If in exponential function exponent is…
Q: Determine if each of the following functions is a growth exponential or a decay exponential. a.…
A:
Q: Plot the number 1 on the log scale below. + + + + 10-5 10-4 10:3 10:2 10-1 100 101 102 103 104 Clear…
A: A logarithm of a number with a base is equal to another number. A logarithm is just the opposite…
Q: Plot the number 0.00032 on the log scale below. 105 104 103 10-2 101 100 101 102 103 104 105 Clear…
A:
Q: Here is the graph of a logarithmic function. yf 4 2 1 1000 2000 3000 4000
A: We can obtain this information from the graph itself. We explain how to obtain the information in…
Q: Which of the two curves exhibits exponential growth?
A: Here Given the two graph
Q: What is the y-intercept of the graph of y = log, (+8)? O (0,-1) O (0,8). O (0,3) O (0,4)
A:
Q: Evaluate the following expression using your calculator. Round the values to the nearest…
A:
Q: The life expectancies of black males in the United States at various ages for 2006 are as shown…
A: Hey, since there are multiple questions posted, we will answer first question. If you want any…
Q: (c) Generate the plot of the table in part 4. in your spreadsheet by displaying log, (E) against M.…
A: Introduction: The given equation, log10 (E) = 4.8 + 1.5 M, gives a very good approximation of the…
Q: For the set of points to the right, determine whether an exponential function, a logarithmic…
A: The function y=logex is the inverse function of y=ex. This is how the exponential graph would look…
Q: Evaluate using your calculator, giving at least 3 decimal places: log(590) =
A: Log (590) Evaluate
Q: Consider the following data in the table -1 -8.4 0.6 9.6 2 18.6 Is the dataset in the table…
A: This question is based on straight line equations.
Q: Evaluate the logarithm log; (23) to the nearest thousandth.
A:
Q: Evaluate Logarithms (Level 1) Feb 24, 2:07:21 PM Watch help video What is the value of log; 512?…
A: Find the value of logarithm
Q: Given the following exponential function, identify whether the change represents growth or decay,…
A:
Q: The life expectancies of black males in the United States at various ages for 2006 are as shown…
A: a) At birth age=0 So coordinate are (0,69.7) and (60,18.2). We find the average rate of change…
Q: complete the following question on using logarithmic scales. how many times more intense is an…
A: Given, Earthquake of magnitude 6.5 than an earthquake of magnitude 3.9.
Q: The graph below represents which of the following regressions? a. square root b. logarithmic c.…
A: Given function is Logarithmic function Because (a) Incorrect square root: is always positive or…
Q: Assume that the dummy variables Married=1 if married (0 if not married), Sex=1 if male (0 if…
A: Given that, Assume that the dummy variables Married=1 if married (0 if not married), Sex=1 if male…
Q: Givethe graphs of some exponential functions?
A: Let us consider the exponential functions, y=2x, y=5x & y=9x
Q: Which of the following display exponential growth? Select all that apply. OP= 750(0.995)*…
A:
Q: Fit an exponential model to the following data:
A: Excel Procedure for fitting Exponential model: Enter the x and y in Excel>Select the x and…
Q: Evaluate Logarithms (Level 1) Feb 24, 2:57:00 PM Watch help video What is the value of log, 36?
A:
Q: Complete the table shown to the right for the population growth model for a certain country. 2006…
A: Population decrease in the proceedings years therefore growth is negative
Q: Nelson invested $100 at 5% interest compounded annually. Which of the following data tables…
A: The invested at time t years when rate of interest is compounded annually is given by:
Q: Evaluate these logs without a calculator: log4 1/16 log3 27
A:
Q: Determine whether the values in the table belong to an exponential function, a logarithmic function,…
A: first, we will subtract the values of y we get the difference x y 0 12 1 3 2 0 3 3 4…
Q: Identify whether the given is a discrete or continuous variable.
A: here use basic of continuous and discrete variable
This shows log GDP per capita for the UK. Which of the following statements are correct?
The graph shows that in 1950 UK GDP per capita was about £8.75.
The trend growth rate over the period was 0.9889% per annum.
When actual output is below trend output the economy is in recession.
The trend growth rate over the period was 2.14 % per annum.


Trending now
This is a popular solution!

Step by step
Solved in 2 steps

- The US. import of wine (in hectoliters) for several years is given in Table 5. Determine whether the trend appearslinear. Ifso, and assuming the trend continues, in what year will imports exceed 12,000 hectoliters?Are the data displayed in the graph above discrete or continuous? What is the level of measurement of the data? Are the data above time series or cross-sectional data? Examine the data for each race/ethnicity group. Do the data represent a stationary or nonstationary process? Do any of the race/ethnicity groups exhibit a decreasing trend? Do any of the race/ethnicity groups show a strictly increasing trend over the entire time period from 2000 to 2016?Illustrate this statement "Endogenous variables are correlated with the error term in the equation of interest; exogenous variables are uncorrelated with this error term".
- For a period of 11 years, the figures in the accompanying table were found for annual change in unemployment rate and annual change in mean employee absence rate due to own illness. Year Change in UnemploymentRate Change in Mean Employee Absence Rate Due to Own Illness (Y) 1 -0.2 0.2 2 -0.1 0.2 3 1.4 0.2 4 1.0 -0.4 5 -0.3 -0.1 6 -0.7 0.2 7 0.7 -0.1 8 2.9 -0.8 9 -0.8 0.2 10 -0.7 0.2 11 -1.0 0.2 a. Estimate the linear regression of change in mean employee absence rate due to own illness on change in unemployment rate. b. Interpret the estimated slope of the regression line. thanks.Suppose the following are the seasonal indices for the first three quarters of the year for a quarterly series: Quarter Seasonal Index Q1 73.9 Q2 84.1 Q3 107.1 Remember that the seasonal indices should average 100 so you should be able to infer the seasonal index for Q4. Furthermore, suppose that the estimated coeffcients from a regression of the deseasonalized series on Time are given below: Coefficients Intercept 2,964 Time 50.7 What is the trend projection of the series for period 119? (please round your answer to 1 decimalIn April of 2012, the Centers for Disease Control and Prevention announced that birth rates for U.S. teenag-ers reached historic lows. From 2009 to 2010 the rate declined 9%, to a level of 34.3 births per 1000 womenaged 15–19. Which of these conclusions is an example ofextrapolation in this context?A) There was a decreasing trend in teenage birth ratesat the time of this study.B) Time is an explanatory variable in the change ofteenage birth rates.C) By 2014, teenage birth rates will be 36% lower andset new records.D) There is a linear relationship between year andteenage birth rates.E) None of these is an example of extrapolation.
- The president of State University wants to forecast student enrollments for this Year academic year based on the following historical data: 5 years ago 4 years ago 3 years ago 2 years ago Last year Enrollments 15.000 16.000 18.000 20.000 21.000 a- What is the forecast for this year using a 3-year weighted moving average where the weights are halved in a descending order from newest to oldest ? b. What is the forecast for this year using the trend line for these data? c. using the MAD find which forecasting technique may be appropriate for this quetionThe table given below indicates New Holding Ltd.’s quarterly profits in 2019 and 2020.Time Period Profit (Thousands Of Rands)2019 Q1 2502019 Q2 2102019 Q3 1652019 Q4 1952020 Q1 2652020 Q2 2182020 Q3 1782020 Q4 204 Determine the trend regression function for this data set. Given that the typical seasonal index for Q3 is 87.3, use this informationand the trend regression function obtained to determine theseasonally adjusted trend estimate for profits in Q3 of 2022........ 1..What is the correlation between average monthly rainfall and crop yield in a given region over the past 10 years, and how does this relationship vary across different types of crops grown in the area?
- 4. Consider the following data. Period 1 rate of return -6.0. Period 2 rate of return -8.0. Period 3 rate of return -4.0. Period 4 rate of return 2.0. Period 5 rate of return 5.4. What is the mean growth rate over these five periods?The table given below indicates Small Holding Ltd.’s quarterly profits in 2019 and2020.Time Period Profit (Thousands Of Rands)2019 Q12019 Q22019 Q32019 Q42020 Q12020 Q22020 Q32020 Q4250210165195265218178204Q.6.3.1 Determine the trend regression function for this data set. In order toobtain full marks for this question, you must complete the relevanttable (template provided below) and then apply the appropriate timeseries formulae in the formulae sheet.The demand for a product for the last six years has been 15, 15, 17, 18, 20, and 19. The manager wants to predict the demand for this time series using the following simple linear trend equation: trt = 12 + 2t. What are the forecast errors for the 5th and 6th years?