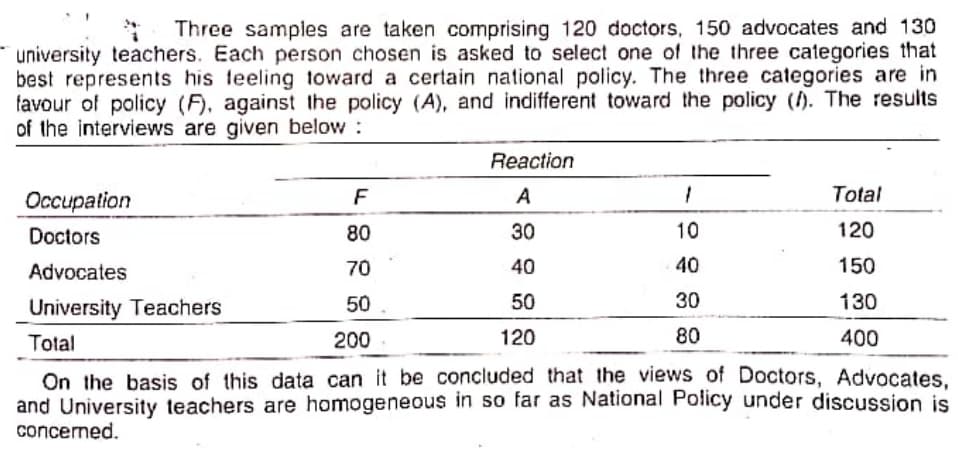
Three samples are taken comprising 120 doctors, 150 advocates and 130 * university teachers. Each person chosen is asked to select one of the three categories that best represents his teeling toward a certain national policy. The three categories are in favour of policy (F), against the policy (A), and indifferent toward the policy (). The results of the interviews are given below : Reaction Occupation F A Total Doctors 80 30 10 120 Advocates 70 40 40 150 University Teachers 50 50 30 130 Total 200 120 80 400 On the basis of this data can it be concluded that the views of Doctors, Advocates. and University teachers are homogeneous in so far as National Policy under discussion is concerned.
Q: 1. What does F-test for significance tell us? 2. What does t-test for significance tell us? 3. C...
A: Given information: What does F-test for significance tell us? 2. What does t-test for significance ...
Q: Show that X ~ N(µ, o²) belongs to the 2-parameter exponential family of densities.
A: Given that X~Nμ,σ2
Q: Example 11. Find the elasticity of demand for the function p= 100 – x-x.
A:
Q: Below is a graph of a normal distribution with mean u =-2 and standard deviation 0 4. The shaded reg...
A:
Q: Show that the serial correlation coefficient p is equal to -1, if n = 2, provided the denominator is...
A: Solution:
Q: A marketing agency gives following information about the age-groups of the - sampie informants and t...
A:
Q: Calculate median from the following data: 30-60 60-80 80-90 Marks 0-10 10-30 2 No. of Students 5 15 ...
A:
Q: Learn the steps involved in constructing and validating an index.
A: An index is a composite statistic.
Q: 1a) Write 17 x 16 x 15 x 14 x 13 x 12 x 11 x 10 x 9 x 8 in the form „P. 1b) Express 21C, as a sum of...
A: Here AS PER POLICY I HAVE CALCULATED 3 SUBPARTS PLZ REPOST FOR REMAINING PARTS HERE USE COMBINATION...
Q: B. A discrete random variable X has the following probability distribution: 77 78 79 80 81 P(x) 0.15...
A:
Q: The Green party of Canada is planning on conducting a survey to estimate the proportion of Canadians...
A:
Q: On a nationwide test taken by high school students, the mean score was 47 and the standard deviation...
A: Given,mean(μ)standard deviation(σ)=11Empirical rules:1) P(μ-σ<X<μ+σ)=68%2) P(μ-2σ<X<μ+2σ...
Q: CONSTRUCT A HISTOGRAM
A: Given that Y Frequency 0 5 1 4 2 6 3 8 4 1 5 1
Q: The following table gives the distribution of the total population and those who are wholly or parti...
A:
Q: Scores on ENGDAT exam are normally distributed with a population standard deviation of 5.6. A random...
A: Given,sample size(n)=40sample mean(x¯)=32population standard deviation(σ)=5.6
Q: An experiment was conducted to determine the effect of exercises on elders' (above 60 years old) mem...
A: Test is that whether there is an effect of exercises on elder's memory. It is given that there are t...
Q: Classify the following statements as to whether they belong to the area of DescriptiveStatistics or ...
A: Descriptive and inferential statistics : The mean, variance, and frequency of a variable are all sam...
Q: Example 16. q =b-!. Show that if T = ae4, then Marginal cost is equakto Average cost provided
A:
Q: If the probability of a bad reaction from a certain injection is 0.001, determine the chance that o...
A: Given: Probability of a bad reaction is, p= 0.001 Sample size, n=3000
Q: expected distribution shape?
A: Here use box plot for represent the given summary
Q: R² and r are defined by SR E(*; – T)(yi – ỹ) Say R? SST' r = VE(x; – #)² L(yi – g)² (1) Show R² = p2...
A: “Since you have asked multiple questions, we will solve the first question for you. If you want any ...
Q: In a simple linear regression model, B1 has important relationships with a sample correlation coeffi...
A: (1) To prove β^1=rSyySxx The general form of regression equation is Y=β0+β1X+ε By minimizing the lea...
Q: If 5 points were added to each score, then standard deviation of the new scores tyould a) be increas...
A: If 5 points were added to each score,then SD of the new scores would
Q: Calculate the expected value of x, the sum of the scores, when two dice are rolled.
A:
Q: The player spins a spinner twice. On each spin the player can get a 1 or a 4 ; P(1) = .4 ...
A: For the specified random variable Xi=amount of winning by the player for the given probability value...
Q: Normal blood sugar levels are less than 100 mg/dL after fasting for at least eight hours. A sample o...
A:
Q: 25. The scores on the Wechsler Adult Intelligence Scale are approximately Normal with u = 100 and o=...
A: Consider that the mean and standard deviation of a random variable X are µ and σ, respectively. Thus...
Q: Use the method of moment to estimate the parameter 0 for the density f(x;0) I10.01 (x) based on a ra...
A:
Q: lew sales representative A corporation damin Management is interested in the extent to which this te...
A: Solution: Let x = Test scores and y= Weekly Sales x y (x-x) (x-x)2 (y-y) (y-y)2 (x-x)(y-y) 55 1...
Q: A typing school claims that in a six-week intensive course, it can train siudents to type, on the av...
A:
Q: What happened to mean of the ratio between
A: @solution::: 1) Proportion of Means: it ascertains the proportion between the amount of defaults o...
Q: I. Mean of the distribution II. P(5)
A: Given: R.V. has Poisson distribution P(1)=P(2)
Q: 5) A coin is tossed four times. Let A = event at least two Tails is tossed, B = the Number of tails ...
A: GivenA coin is tossed four timesLet A = event atleast two tails is tossedLet B = the number of tails...
Q: D. Direction: Compute the following probabilities using the standard normal curve. Construct a curve...
A:
Q: Count Respondents sex MALE FEMALE Total Favor or FAVOR 30 27 57 oppose death (expected) penalty for ...
A: Any assumption about the parameter or probability function is known as hypothesis testing. For the G...
Q: Analyse the frequency distribution by the method of moments: X: 2 3 4 5 6 f. 1 3 7 3
A:
Q: Let X1, X2, ..., Xn be a random sample from a Uniform(0,0 + 1) population with 0 > 0, *(3)**(3+1) X ...
A: Given that, Let X1,X2,...,Xnbe a random sample from a uniform θ,θ+1population with θ>0 where n is...
Q: Chapter 06, Supplementary Exercises, Problem 056 A machine at Kasem Steel Corporation makes iron rod...
A:
Q: Question 5 O out of 1 po The arithmetic mean of two numbers is 145 and its geometric mean is 55. Fin...
A: Arithmetic mean : The arithmetic mean is the most basic and extensively used method of calculating a...
Q: NBC News/Marist sampled 603 likely voters on 10-31-14. They found that 44% said they would vote for ...
A:
Q: Suppose that a satellite defense system has 3 satellites that operate independently. Each satellite...
A: It is needed to determine the probability distribution for the random variable X.
Q: A school has to select one student to take part in a Philippines Math Wizard. Anne and Bong took par...
A: Box whisker plot is a graph that helps to understand the spread of the data. It helps to estimate th...
Q: Lesson 13 Q10 P(0 < Z< 1.06) = A.1.06 B.1 C.0.3554 D.0.1446
A:
Q: a. P (at most 3) b. P (one or more) C. mean u
A: Given: X has Hypergeometric distribution with N=15, n=4, k=5
Q: (b) (For Math 5090 students) Let X be an nxq data matrix, S its sample covariance matrix and y,, j =...
A: @solution::
Q: Two cards are selected at random from a box which contains five cards numbered 1, 1, 2, 2, and 3. Le...
A:
Q: Suppose you wanted to create an index for rating the quality of colleges and universities. What are ...
A: An index is a composite statistic.
Q: Example 13. Find the mean from the following data : Marks No. of students Marks No. of students Belo...
A:
Q: (a) Find Bowley's coefficient of skewness for the following frequency distribution:- No. of children...
A: Given: No. of children per family No. of families 0 7 1 10 2 16 3 25 4 18 5 41 6 8
Q: 1a. The distribution of the mark scored by three candidate in a professional examination are 54, 24,...
A: 1a. Given The data is as follows: 54, 24, 36
Step by step
Solved in 3 steps with 3 images
- A study classified each of 134 lawyers into one of four groups based on observation and an interview. The 62 lawyers in group A were categorized as having high levels of stimulation and support and average levels of public spirit. The 52 lawyers in group B had low stimulation, average support, and high public spirit. Group C contained 7 lawyers with average stimulation, low support, and low public spirit. The 13 lawyers in group D were assessed as low on all three criteria. Salary levels for these four groups were compared. The sample means were 7.87 for group A, 7.47 for group B, 5.14 for group C, and 3.69 for group D. The F ratio calculated from these data was 25.60. a. Prepare the complete analysis of variance table. b. Test the null hypothesis that the population mean salaries are the same for lawyers in these four groups.In a large clinical trial, 394,003 children were randomly assigned to two groups. The treatment group consisted of 198,861 children given a vaccine for a certain disease, and 26 of those children developed the disease. The other 195,142 children were given a placebo, and 79 of those children developed the disease. Consider the vaccine treatment group to be the first sample. Identify the values of n1, p1, q1, n2, p2, q2, p, and q.In a large clinical trial, 401,476children were randomly assigned to two groups. The treatment group consisted of 202,144 children given a vaccine for a certain disease, and 29 of those children developed the disease. The other 199,332 children were given a placebo, and 113 of those children developed the disease. Consider the vaccine treatment group to be the first sample. Identify the values of n1, p1, q1, n2, p2, q2, p, and q. n^1=
- In a large clinical trial, 401,068 children were randomly assigned to two groups. The treatment group consisted of 201,565 children given a vaccine for a certain disease, and 33 of those children developed the disease. The other 199,503 children were given a placebo, and 99 of those children developed the disease. Consider the vaccine treatment group to be the first sample. Identify the values of n1, p1, q1, n2, p2, q2, p, and q. Question content area bottom Part 1 n1=enter your response here Part 2 p1=enter your response here (Type an integer or a decimal rounded to eight decimal places as needed.) Part 3 q1=enter your response here (Type an integer or a decimal rounded to eight decimal places as needed.) Part 4 n2=enter your response here Part 5 p2=enter your response here (Type an integer or a decimal rounded to eight decimal places as needed.) Part 6 q2=enter your response here (Type an integer or a decimal rounded to eight decimal places…In a large clinical trial, 401,575 children were randomly assigned to two groups. The treatment group consisted of 199,542 children given a vaccine for a certain disease, and 39 of those children developed the disease. The other 202,033 children were given a placebo, and 120 of those children developed the disease. Consider the vaccine treatment group to be the first sample. Identify the values of n1, p1, q1, n2, p2, q2, p, andq. n1= p1= (Type an integer or a decimal rounded to eight decimal places as needed.) q1= (Type an integer or a decimal rounded to eight decimal places as needed.) n2= p2= (Type an integer or a decimal rounded to eight decimal places as needed.) q2= (Type an integer or a decimal rounded to eight decimal places as needed.) p= (Type an integer or a decimal rounded to eight decimal places as needed.) q= (Type an integer or a decimal rounded to eight decimal places as needed.)In a large clinical trial, 397,970 children were randomly assigned to two groups. The treatment group consisted of 197,753 children given a vaccine for a certain disease, and 30 of those children developed the disease. The other 200,217 children were given a placebo, and 114 of those children developed the disease. Consider the vaccine treatment group to be the first sample. Identify the values of n1,p1,q1,n2,p2,q2,p, and q.
- In a large clinical trial, 390,537 children were randomly assigned to two groups. The treatment group consisted of 196,569 children given a vaccine for a certain disease, and 32 of those children developed the disease. The other 193,968 children were given a placebo, and 98 of those children developed the disease. Consider the vaccine treatment group to be the first sample. Identify the values of n1, p1, q1, n2, p2, q2, p, and q. n1=enter your response here p1=enter your response here (Type an integer or a decimal rounded to eight decimal places as needed.) q1=enter your response here (Type an integer or a decimal rounded to eight decimal places as needed.) n2=enter your response here p2=enter your response here (Type an integer or a decimal rounded to eight decimal places as needed.) q2=enter your response here (Type an integer or a decimal rounded to eight decimal places as needed.) p=enter your response here (Type an integer or a decimal…The manager of High Point Sofa and Chair, a large furniture manufacturer located in North Carolina, is studying the job performance ratings of a sample of 15 electrical repairmen employed by the company. An aptitude test is required by the human resources department to become an electrical repairman. The manager was able to get the score for each repairman in the sample. In addition, he determined which of the repairmen were union members (code = 1) and which were not (code = 0). The sample information is reported below. Worker Job Performance Score Aptitude Test Score Union Membership Abbott 58 5 0 Anderson 53 4 0 Bender 33 10 0 Bush 97 10 0 Center 36 2 0 Coombs 83 7 0 Eckstine 67 6 0 Gloss 84 9 0 Herd 98 9 1 Householder 45 2 1 Lori 97 8 1 Lindstrom 90 6 1 Mason 96 7 1 Pierse 66 3 1 Rohde 82 6 1 Click here for the Excel Data File. a-1. Use a statistical…In a large clinical trial, 394,299 children were randomly assigned to two groups. The treatment group consisted of 195,477children given a vaccine for a certain disease, and 26 of those children developed the disease. The other 198,822children were given a placebo, and 91 of those children developed the disease. Consider the vaccine treatment group to be the first sample. Identify the values of n1, p1, q1, p2, q2, n2, p, and q.
- An insurance company is thinking about offering discounts on its life insurance policies to nonsmokers. As part of its analysis, the company randomly selects 200 men who are 60 years old and ask them if they smoke at least one pack of cigarettes per day and if they have ever suffered from heart disease. 10 out of the 38 smokers had suffered from some type of heart disease and 12 out of 150 nonsmokers had suffered from some type of heart disease. Can we conclude at the 5% level of significance that smokers have a higher incidence of heart disease than nonsmokers? (Don't hand writing solution)If a hurricane was headed your way, would you evacuate? The headline of a press release states, "Thirty-two Percent of People on High-Risk Coast Will Refuse Evacuation Order, Survey of Hurricane Preparedness Finds." This headline was based on a survey of 4229 adults who live within 20 milesof the coast in high hurricane risk counties of eight southern states. In selecting the sample, care was taken to ensure that the sample would be representative of the population of coastal residents in these states. (a) Use this information to estimate the proportion of coastal residents who would evacuate using a 98% confidence interval. (Round your answers to three decimal places.)( , )To investigate whether there is a significant difference between two regions of a state in the percent of voters who intend to vote for the incumbent governor in the next election, a polling agency interviewed 300 randomly selected voters from the north of the state and 400 randomly selected voters from the south of the state. Of those interviewed, 200 from the north and 325 from the south indicated they intended to vote for the incumbent governor in the next election. Which of the following is the most appropriate method for analyzing the results? A one-sample zz-test for a sample proportion A A one-sample zz-test for a population proportion B A two-sample zz-test for a sample proportion C A two-sample zz-test for a difference in sample proportions D A two-sample zz-test for a difference in population proportions E