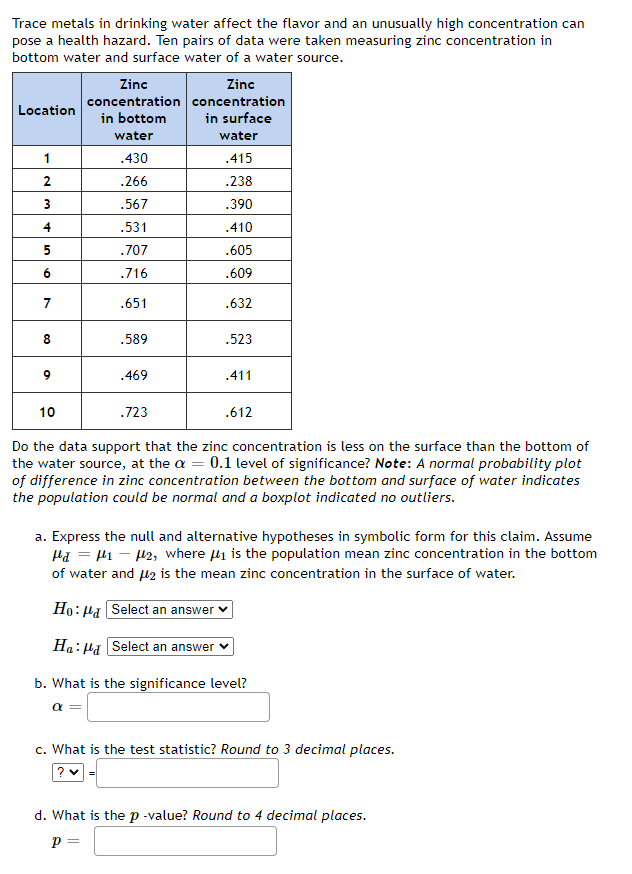
Trace metals in drinking water affect the flavor and an unusually high concentration can pose a health hazard. Ten pairs of data were taken measuring zinc concentration in bottom water and surface water of a water source. Zinc Zinc concentration concentration in bottom Location in surface water water 1 .430 .415 2 .266 .238 3 .567 .390 4 .531 .410 .707 .605 6 .716 .609 7 .651 .632 8 .589 .523 9 .469 .411 10 .723 .612 Do the data support that the zinc concentration is less on the surface than the bottom of the water source, at the a = 0.1 level of significance? Note: A normal probability plot of difference in zinc concentration between the bottom and surface of water indicates the population could be normal and a boxplot indicated no outliers. a. Express the null and alternative hypotheses in symbolic form for this claim. Assume Ha = H1 - 12, where i is the population mean zinc concentration in the bottom of water and l2 is the mean zinc concentration in the surface of water. Ho: Ha Select an answer ♥ Ha:Ha Select an answer b. What is the significance level? c. What is the test statistic? Round to 3 decimal places. ? v d. What is the p -value? Round to 4 decimal places. p =
Trace metals in drinking water affect the flavor and an unusually high concentration can pose a health hazard. Ten pairs of data were taken measuring zinc concentration in bottom water and surface water of a water source. Zinc Zinc concentration concentration in bottom Location in surface water water 1 .430 .415 2 .266 .238 3 .567 .390 4 .531 .410 .707 .605 6 .716 .609 7 .651 .632 8 .589 .523 9 .469 .411 10 .723 .612 Do the data support that the zinc concentration is less on the surface than the bottom of the water source, at the a = 0.1 level of significance? Note: A normal probability plot of difference in zinc concentration between the bottom and surface of water indicates the population could be normal and a boxplot indicated no outliers. a. Express the null and alternative hypotheses in symbolic form for this claim. Assume Ha = H1 - 12, where i is the population mean zinc concentration in the bottom of water and l2 is the mean zinc concentration in the surface of water. Ho: Ha Select an answer ♥ Ha:Ha Select an answer b. What is the significance level? c. What is the test statistic? Round to 3 decimal places. ? v d. What is the p -value? Round to 4 decimal places. p =

Linear Algebra: A Modern Introduction
4th Edition
ISBN:9781285463247
Author:David Poole
Publisher:David Poole
Chapter4: Eigenvalues And Eigenvectors
Section4.6: Applications And The Perron-frobenius Theorem
Problem 22EQ

Related questions
Question
Transcribed Image Text:Trace metals in drinking water affect the flavor and an unusually high concentration can
pose a health hazard. Ten pairs of data were taken measuring zinc concentration in
bottom water and surface water of a water source.
Zinc
Zinc
concentration concentration
in bottom
Location
in surface
water
water
1
.430
.415
.266
.238
3
.567
.390
4
.531
.410
.707
.605
.716
.609
7
.651
.632
8
.589
.523
.469
.411
10
.723
.612
Do the data support that the zinc concentration is less on the surface than the bottom of
the water source, at the a = 0.1 level of significance? Note: A normal probability plot
of difference in zinc concentration between the bottom and surface of water indicates
the population could be normal and a boxplot indicated no outliers.
a. Express the null and alternative hypotheses in symbolic form for this claim. Assume
Ha = H1 – 12, where li is the population mean zinc concentration in the bottom
of water and 42 is the mean zinc concentration in the surface of water.
Ho: Ha Select an answer v
Ha:Ha Select an answer
b. What is the significance level?
a =
c. What is the test statistic? Round to 3 decimal places.
d. What is the p -value? Round to 4 decimal places.
p =
Expert Solution
This question has been solved!
Explore an expertly crafted, step-by-step solution for a thorough understanding of key concepts.

Step by step
Solved in 4 steps with 2 images

Recommended textbooks for you
Linear Algebra: A Modern Introduction
Algebra
ISBN:
9781285463247
Author:
David Poole
Publisher:
Cengage Learning

Big Ideas Math A Bridge To Success Algebra 1: Stu…
Algebra
ISBN:
9781680331141
Author:
HOUGHTON MIFFLIN HARCOURT
Publisher:
Houghton Mifflin Harcourt

Glencoe Algebra 1, Student Edition, 9780079039897…
Algebra
ISBN:
9780079039897
Author:
Carter
Publisher:
McGraw Hill
Linear Algebra: A Modern Introduction
Algebra
ISBN:
9781285463247
Author:
David Poole
Publisher:
Cengage Learning
Big Ideas Math A Bridge To Success Algebra 1: Stu…
Algebra
ISBN:
9781680331141
Author:
HOUGHTON MIFFLIN HARCOURT
Publisher:
Houghton Mifflin Harcourt
Glencoe Algebra 1, Student Edition, 9780079039897…
Algebra
ISBN:
9780079039897
Author:
Carter
Publisher:
McGraw Hill