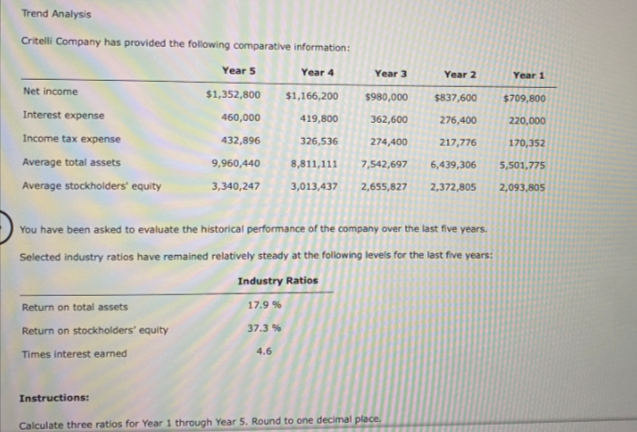
Trend Analysis Critelli Company has provided the following comparative information: Year 5 Year 4 Year 3 Year 2 Year 1 Net income $1,352,800 $1,166,200 $980,000 $837,600 $709,800 Interest expense 460,000 419,800 362,600 276,400 220,000 Income tax expense 432,896 326,536 274,400 217,776 170,352 Average total assets 9,960,440 8,811,111 7,542,697 6,439,306 5,501,775 Average stockholders' equity 3,340,247 3,013,437 2,655,827 2,372,805 2,093,805 You have been asked to evaluate the historical performance of the company over the last five years. Selected industry ratios have remained relatively steady at the following levels for the last five years: Industry Ratios Return on total assets 17.9 % Return on stockholders' equity 37.3 % Times interest earned 4.6 Instructions: Calculate three ratios for Year 1 through Year 5. Round to one decimal place.
Trend Analysis Critelli Company has provided the following comparative information: Year 5 Year 4 Year 3 Year 2 Year 1 Net income $1,352,800 $1,166,200 $980,000 $837,600 $709,800 Interest expense 460,000 419,800 362,600 276,400 220,000 Income tax expense 432,896 326,536 274,400 217,776 170,352 Average total assets 9,960,440 8,811,111 7,542,697 6,439,306 5,501,775 Average stockholders' equity 3,340,247 3,013,437 2,655,827 2,372,805 2,093,805 You have been asked to evaluate the historical performance of the company over the last five years. Selected industry ratios have remained relatively steady at the following levels for the last five years: Industry Ratios Return on total assets 17.9 % Return on stockholders' equity 37.3 % Times interest earned 4.6 Instructions: Calculate three ratios for Year 1 through Year 5. Round to one decimal place.

Survey of Accounting (Accounting I)
8th Edition
ISBN:9781305961883
Author:Carl Warren
Publisher:Carl Warren
Chapter1: The Role Of Accounting In Business
Section: Chapter Questions
Problem 1.4.2MBA: Return on assets The following data (in millions) were adapted from recent financial statements of...

Related questions
Question
Transcribed Image Text:Trend Analysis
Critelli Company has provided the following comparative information:
Year 5
Year 4
Year 3
Year 2
Year 1
Net income
$1,352,800
$1,166,200
$980,000
$837,600
$709,800
Interest expense
460,000
419,800
362,600
276,400
220,000
Income tax expense
432,896
326,536
274,400
217,776
170,352
Average total assets
9,960,440
8,811,111
7,542,697
6,439,306
5,501,775
Average stockholders' equity
3,340,247
3,013,437
2,655,827
2,372,805
2,093,805
You have been asked to evaluate the historical performance of the company over the last five years.
Selected industry ratios have remained relatively steady at the following levels for the last five years:
Industry Ratios
Return on total assets
17.9 %
Return on stockholders' equity
37.3 %
Times interest earned
4.6
Instructions:
Calculate three ratios for Year 1 through Year 5. Round to one decimal place.
Expert Solution
This question has been solved!
Explore an expertly crafted, step-by-step solution for a thorough understanding of key concepts.

This is a popular solution!

Trending now
This is a popular solution!

Step by step
Solved in 2 steps with 4 images

Recommended textbooks for you
Survey of Accounting (Accounting I)
Accounting
ISBN:
9781305961883
Author:
Carl Warren
Publisher:
Cengage Learning

Managerial Accounting
Accounting
ISBN:
9781337912020
Author:
Carl Warren, Ph.d. Cma William B. Tayler
Publisher:
South-Western College Pub

Financial And Managerial Accounting
Accounting
ISBN:
9781337902663
Author:
WARREN, Carl S.
Publisher:
Cengage Learning,
Survey of Accounting (Accounting I)
Accounting
ISBN:
9781305961883
Author:
Carl Warren
Publisher:
Cengage Learning
Managerial Accounting
Accounting
ISBN:
9781337912020
Author:
Carl Warren, Ph.d. Cma William B. Tayler
Publisher:
South-Western College Pub
Financial And Managerial Accounting
Accounting
ISBN:
9781337902663
Author:
WARREN, Carl S.
Publisher:
Cengage Learning,

Financial Reporting, Financial Statement Analysis…
Finance
ISBN:
9781285190907
Author:
James M. Wahlen, Stephen P. Baginski, Mark Bradshaw
Publisher:
Cengage Learning

College Accounting, Chapters 1-27
Accounting
ISBN:
9781337794756
Author:
HEINTZ, James A.
Publisher:
Cengage Learning,

Corporate Financial Accounting
Accounting
ISBN:
9781337398169
Author:
Carl Warren, Jeff Jones
Publisher:
Cengage Learning