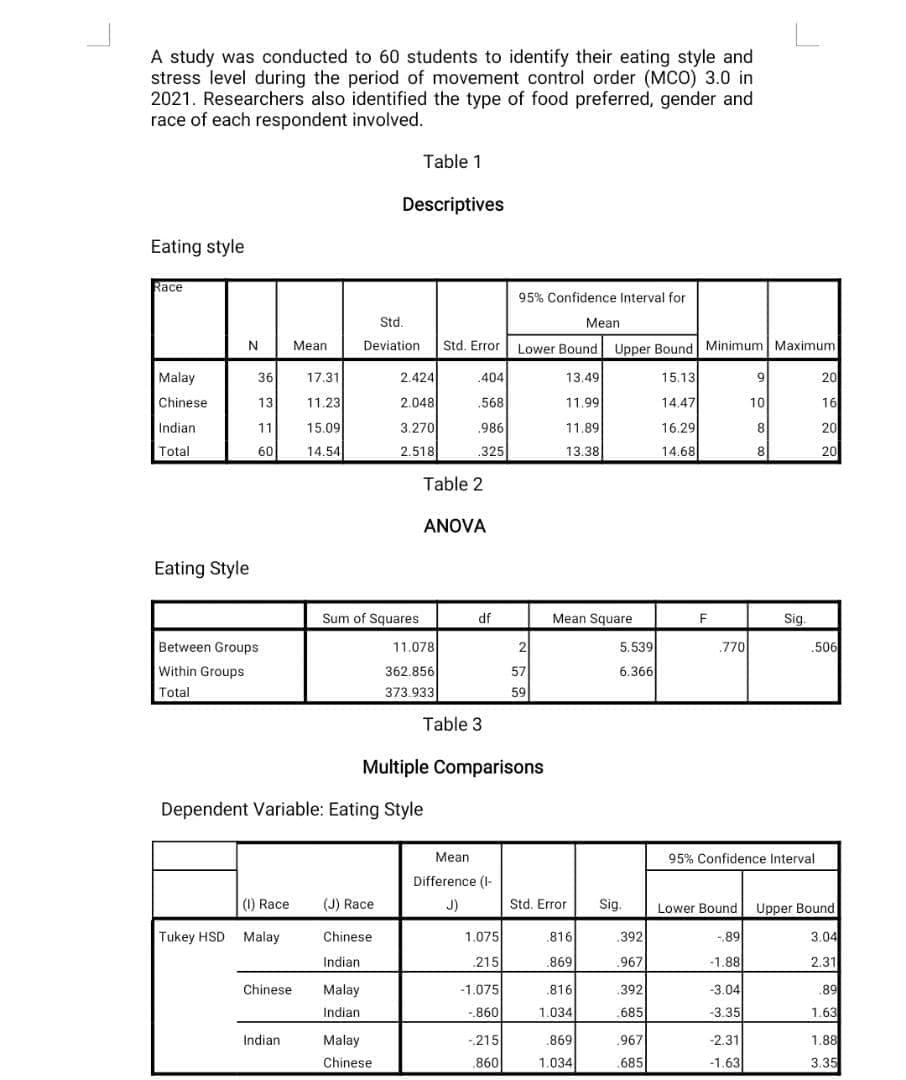
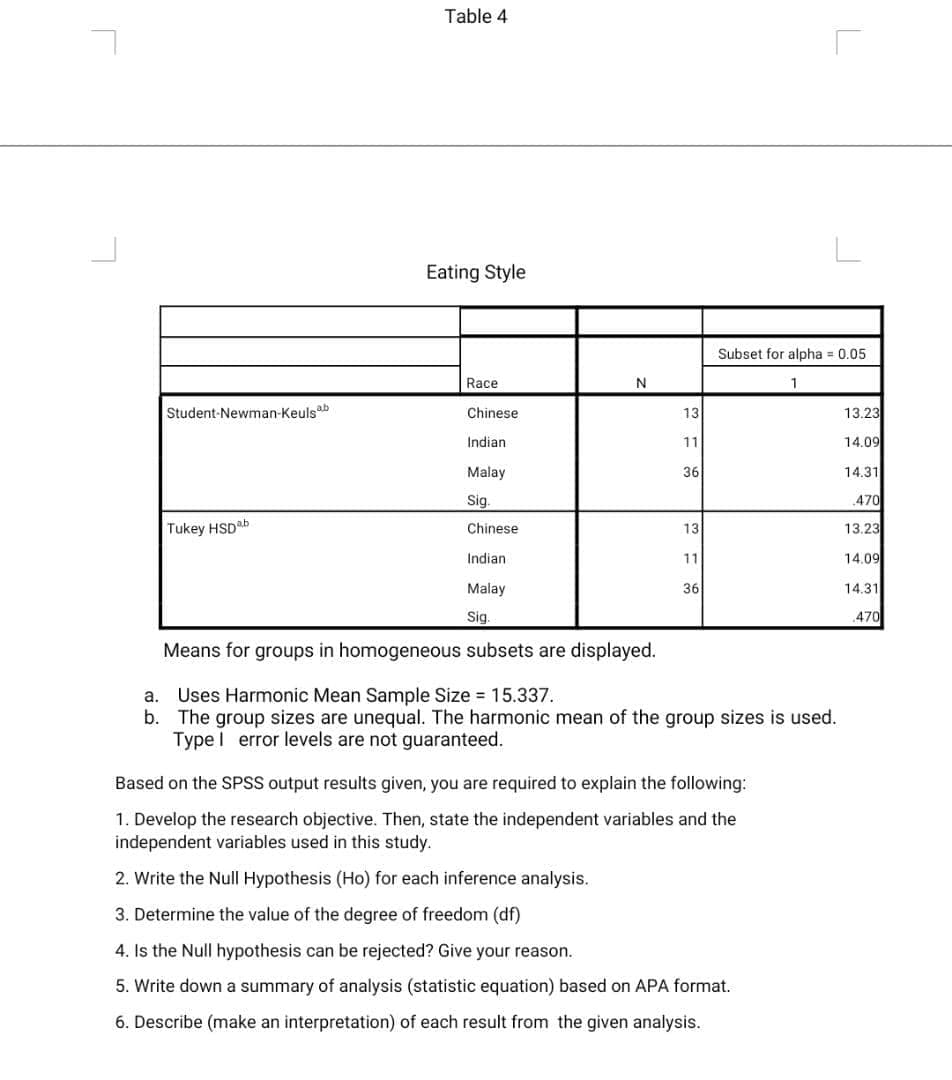
tudy was conducted to 60 students to identify their eati ss level during the period of movement control order ( 1. Researchers also identified the type of food preferred, e of each respondent involved. Table 1

MATLAB: An Introduction with Applications
6th Edition
ISBN:9781119256830
Author:Amos Gilat
Publisher:Amos Gilat
Chapter1: Starting With Matlab
Section: Chapter Questions
Problem 1P
icon
Related questions
icon
Concept explainers
Topic Video
Question
A study was conducted to 60 students to identify their eating style and
stress level during the period of movement control order (MCO) 3.0 in
2021. Researchers also identified the type of food preferred, gender and
race of each respondent involved.
Table 1
Descriptives
Eating style
Race
95% Confidence Interval for
Std.
Mean
N
Mean
Deviation
Std. Error Lower Bound Upper Boundl Minimum Maximum
Malay
36
17.31
2.424
404
13.49
15.13
9
20
Chinese
13
11.23
2.048
568
11.99
14.47
10
16
Indian
11
15.09
3.270
.986
11.89
16.29
20
Total
60
14.54
2.518
.325
13.38
14.68
20
Table 2
ANOVA
Eating Style
Sum of Squares
df
Mean Square
Sig.
Between Groups
11.078
2
5.539|
770
506
362.856
373.933
Within Groups
57
6.366
Total
59
Table 3
Multiple Comparisons
Dependent Variable: Eating Style
Mean
95% Confidence Interval
Difference (I-
(1) Race
(J) Race
J)
Std. Error
Sig.
Lower Bound
Upper Bound
Tukey HSD Malay
Chinese
1.075
816
392
-89
3.04
Indian
215
.869
.967
-1.88
2.31
Chinese
Malay
-1.075
.816
392
-3.04
.89
Indian
860
1.034
.685
-3.35
1.63
Indian
Malay
-215
.869
967
-2.31
1.88
Chinese
.860
1.034
.685
-1.63
3.35
Transcribed Image Text:A study was conducted to 60 students to identify their eating style and stress level during the period of movement control order (MCO) 3.0 in 2021. Researchers also identified the type of food preferred, gender and race of each respondent involved. Table 1 Descriptives Eating style Race 95% Confidence Interval for Std. Mean N Mean Deviation Std. Error Lower Bound Upper Boundl Minimum Maximum Malay 36 17.31 2.424 404 13.49 15.13 9 20 Chinese 13 11.23 2.048 568 11.99 14.47 10 16 Indian 11 15.09 3.270 .986 11.89 16.29 20 Total 60 14.54 2.518 .325 13.38 14.68 20 Table 2 ANOVA Eating Style Sum of Squares df Mean Square Sig. Between Groups 11.078 2 5.539| 770 506 362.856 373.933 Within Groups 57 6.366 Total 59 Table 3 Multiple Comparisons Dependent Variable: Eating Style Mean 95% Confidence Interval Difference (I- (1) Race (J) Race J) Std. Error Sig. Lower Bound Upper Bound Tukey HSD Malay Chinese 1.075 816 392 -89 3.04 Indian 215 .869 .967 -1.88 2.31 Chinese Malay -1.075 .816 392 -3.04 .89 Indian 860 1.034 .685 -3.35 1.63 Indian Malay -215 .869 967 -2.31 1.88 Chinese .860 1.034 .685 -1.63 3.35
Table 4
Eating Style
Subset for alpha = 0.05
Race
1
Student-Newman-Keulsab
Chinese
13
13.23
Indian
11
14.09
Malay
36
14.31
Sig.
.470
Tukey HSDab
Chinese
13
13.23
Indian
11
14.09
Malay
36
14.31
Sg.
470
Means for groups in homogeneous subsets are displayed.
Uses Harmonic Mean Sample Size = 15.337.
b. The group sizes are unequal. The harmonic mean of the group sizes is used.
Type l error levels are not guaranteed.
a.
Based on the SPSS output results given, you are required to explain the following:
1. Develop the research objective. Then, state the independent variables and the
independent variables used in this study.
2. Write the Null Hypothesis (Ho) for each inference analysis.
3. Determine the value of the degree of freedom (df)
4. Is the Null hypothesis can be rejected? Give your reason.
5. Write down a summary of analysis (statistic equation) based on APA format.
6. Describe (make an interpretation) of each result from the given analysis.
Transcribed Image Text:Table 4 Eating Style Subset for alpha = 0.05 Race 1 Student-Newman-Keulsab Chinese 13 13.23 Indian 11 14.09 Malay 36 14.31 Sig. .470 Tukey HSDab Chinese 13 13.23 Indian 11 14.09 Malay 36 14.31 Sg. 470 Means for groups in homogeneous subsets are displayed. Uses Harmonic Mean Sample Size = 15.337. b. The group sizes are unequal. The harmonic mean of the group sizes is used. Type l error levels are not guaranteed. a. Based on the SPSS output results given, you are required to explain the following: 1. Develop the research objective. Then, state the independent variables and the independent variables used in this study. 2. Write the Null Hypothesis (Ho) for each inference analysis. 3. Determine the value of the degree of freedom (df) 4. Is the Null hypothesis can be rejected? Give your reason. 5. Write down a summary of analysis (statistic equation) based on APA format. 6. Describe (make an interpretation) of each result from the given analysis.
Expert Solution
trending now

Trending now

This is a popular solution!

steps

Step by step

Solved in 2 steps

Blurred answer
Knowledge Booster
Centre, Spread, and Shape of a Distribution
Learn more about
Need a deep-dive on the concept behind this application? Look no further. Learn more about this topic, statistics and related others by exploring similar questions and additional content below.
Similar questions
  • SEE MORE QUESTIONS
Recommended textbooks for you
MATLAB: An Introduction with Applications
Statistics
ISBN:
9781119256830
Author:
Amos Gilat
Publisher:
John Wiley & Sons Inc
Probability and Statistics for Engineering and th…
Statistics
ISBN:
9781305251809
Author:
Jay L. Devore
Publisher:
Cengage Learning
Statistics for The Behavioral Sciences (MindTap C…
Statistics
ISBN:
9781305504912
Author:
Frederick J Gravetter, Larry B. Wallnau
Publisher:
Cengage Learning
Elementary Statistics: Picturing the World (7th E…
Statistics
ISBN:
9780134683416
Author:
Ron Larson, Betsy Farber
Publisher:
PEARSON
The Basic Practice of Statistics
Statistics
ISBN:
9781319042578
Author:
David S. Moore, William I. Notz, Michael A. Fligner
Publisher:
W. H. Freeman
Introduction to the Practice of Statistics
Statistics
ISBN:
9781319013387
Author:
David S. Moore, George P. McCabe, Bruce A. Craig
Publisher:
W. H. Freeman