Twenty different statistics students are randomly selected. For each of them, their body temperature (°C) is measured and their head circumference (cm) is measured. a. For this sample of paired data, what does r represent, and what does p represent? b. Without doing any research or calculations, estimate the value of r. c. Does r change if body temperatures are converted to Fahrenheit degrees? O A. ris a statistic that represents the value of the linear correlation coefficient computed from the paired sample data, and p is a parameter that represents the proportion of the variation variation in body temperature. head circumference that can be explained by O B. ris a statistic that represents the proportion of the variation in head circumference that can be explained by variation in body temperature, and p is a parameter that represents the value of the linear correlation coefficient that would be computed by using all of the paired data in the population of all statistics students. OC. ris a parameter that represents the value of the linear correlation coefficient that would be computed by using all of the paired data in the population of all statistics students, and p is a statistic that represents the value of the linear correlation coefficient computed from the paired sample data. O D. ris a statistic that represents the value of the linear correlation coefficient computed from the paired sample data, and p is a parameter that represents the value of the linear correlation coefficient that would be computed by using all of the paired data in the population of all statistics students. b. Select the correct choice below and fill in the answer box to complete your choice. (Type an integer or a decimal rounded to one decimal place as needed.) O A. The value of r is estimated to be, because it is likely that there is no correlation between body temperature and head circumference. O B. The value of r is estimated to be , because it is likely that body temperature and head circumference are strongly positively correlated. O C. The value of r is estimated to be , because it is likely that body temperature and head circumference are strongly negatively correlated. c. Choose the correct answer below. O A. The value of r changes, because r is affected by converting all values of a variable to a different scale. OB. The value of r does not change. hecause r is not affected bv relationshins that are not linear.
Twenty different statistics students are randomly selected. For each of them, their body temperature (°C) is measured and their head circumference (cm) is measured. a. For this sample of paired data, what does r represent, and what does p represent? b. Without doing any research or calculations, estimate the value of r. c. Does r change if body temperatures are converted to Fahrenheit degrees? O A. ris a statistic that represents the value of the linear correlation coefficient computed from the paired sample data, and p is a parameter that represents the proportion of the variation variation in body temperature. head circumference that can be explained by O B. ris a statistic that represents the proportion of the variation in head circumference that can be explained by variation in body temperature, and p is a parameter that represents the value of the linear correlation coefficient that would be computed by using all of the paired data in the population of all statistics students. OC. ris a parameter that represents the value of the linear correlation coefficient that would be computed by using all of the paired data in the population of all statistics students, and p is a statistic that represents the value of the linear correlation coefficient computed from the paired sample data. O D. ris a statistic that represents the value of the linear correlation coefficient computed from the paired sample data, and p is a parameter that represents the value of the linear correlation coefficient that would be computed by using all of the paired data in the population of all statistics students. b. Select the correct choice below and fill in the answer box to complete your choice. (Type an integer or a decimal rounded to one decimal place as needed.) O A. The value of r is estimated to be, because it is likely that there is no correlation between body temperature and head circumference. O B. The value of r is estimated to be , because it is likely that body temperature and head circumference are strongly positively correlated. O C. The value of r is estimated to be , because it is likely that body temperature and head circumference are strongly negatively correlated. c. Choose the correct answer below. O A. The value of r changes, because r is affected by converting all values of a variable to a different scale. OB. The value of r does not change. hecause r is not affected bv relationshins that are not linear.

Holt Mcdougal Larson Pre-algebra: Student Edition 2012
1st Edition
ISBN:9780547587776
Author:HOLT MCDOUGAL
Publisher:HOLT MCDOUGAL
Chapter11: Data Analysis And Probability
Section11.4: Collecting Data
Problem 3E

Related questions

Concept explainers
Contingency Table
A contingency table can be defined as the visual representation of the relationship between two or more categorical variables that can be evaluated and registered. It is a categorical version of the scatterplot, which is used to investigate the linear relationship between two variables. A contingency table is indeed a type of frequency distribution table that displays two variables at the same time.
Binomial Distribution
Binomial is an algebraic expression of the sum or the difference of two terms. Before knowing about binomial distribution, we must know about the binomial theorem.
Topic Video
Question
2
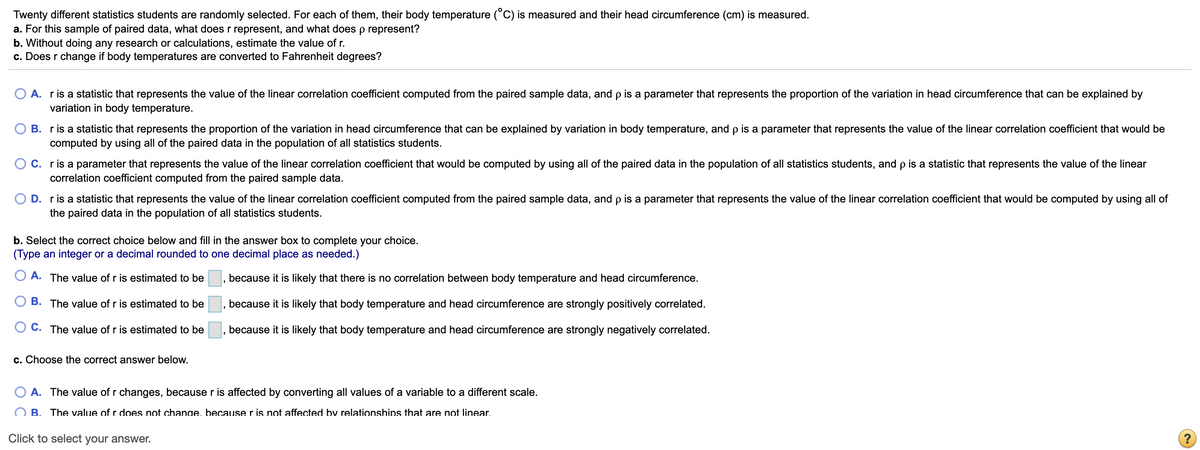
Transcribed Image Text:Twenty different statistics students are randomly selected. For each of them, their body temperature (°C) is measured and their head circumference (cm) is measured.
a. For this sample of paired data, what does r represent, and what does p represent?
b. Without doing any research or calculations, estimate the value of r.
c. Does r change if body temperatures are converted to Fahrenheit degrees?
A. ris a statistic that represents the value of the linear correlation coefficient computed from the paired sample data, and p is a parameter that represents the proportion of the variation in head circumference that can be explained by
variation in body temperature.
B. ris a statistic that represents the proportion of the variation in head circumference that can be explained by variation in body temperature, and p is a parameter that represents the value of the linear correlation coefficient that would be
computed by using all of the paired data in the population of all statistics students.
C. ris a parameter that represents the value of the linear correlation coefficient that would be computed by using all of the paired data in the population of all statistics students, and p is a statistic that represents the value of the linear
correlation coefficient computed from the paired sample data.
D. r is a statistic that represents the value of the linear correlation coefficient computed from the paired sample data, and p is a parameter that represents the value of the linear correlation coefficient that would be computed by using all of
the paired data in the population of all statistics students.
b. Select the correct choice below and fill in the answer box to complete your choice.
(Type an integer or a decimal rounded to one decimal place as needed.)
A. The value of r is estimated to be
because it is likely that there is no correlation between body temperature and head circumference.
B. The value of r is estimated to be
because it is likely that body temperature and head circumference are strongly positively correlated.
O C. The value of r is estimated to be
because it is likely that body temperature and head circumference are strongly negatively correlated.
c. Choose the correct answer below.
O A. The value of r changes, because r is affected by converting all values of a variable to a different scale.
O B. The value of r does not chanae, becauser is not affected by relationships that are not linear.
Click to select your answer.
(?
Expert Solution
This question has been solved!
Explore an expertly crafted, step-by-step solution for a thorough understanding of key concepts.

Step by step
Solved in 4 steps

Knowledge Booster


Learn more about
Need a deep-dive on the concept behind this application? Look no further. Learn more about this topic, statistics and related others by exploring similar questions and additional content below.Recommended textbooks for you
Holt Mcdougal Larson Pre-algebra: Student Edition…
Algebra
ISBN:
9780547587776
Author:
HOLT MCDOUGAL
Publisher:
HOLT MCDOUGAL

College Algebra (MindTap Course List)
Algebra
ISBN:
9781305652231
Author:
R. David Gustafson, Jeff Hughes
Publisher:
Cengage Learning
Holt Mcdougal Larson Pre-algebra: Student Edition…
Algebra
ISBN:
9780547587776
Author:
HOLT MCDOUGAL
Publisher:
HOLT MCDOUGAL
College Algebra (MindTap Course List)
Algebra
ISBN:
9781305652231
Author:
R. David Gustafson, Jeff Hughes
Publisher:
Cengage Learning