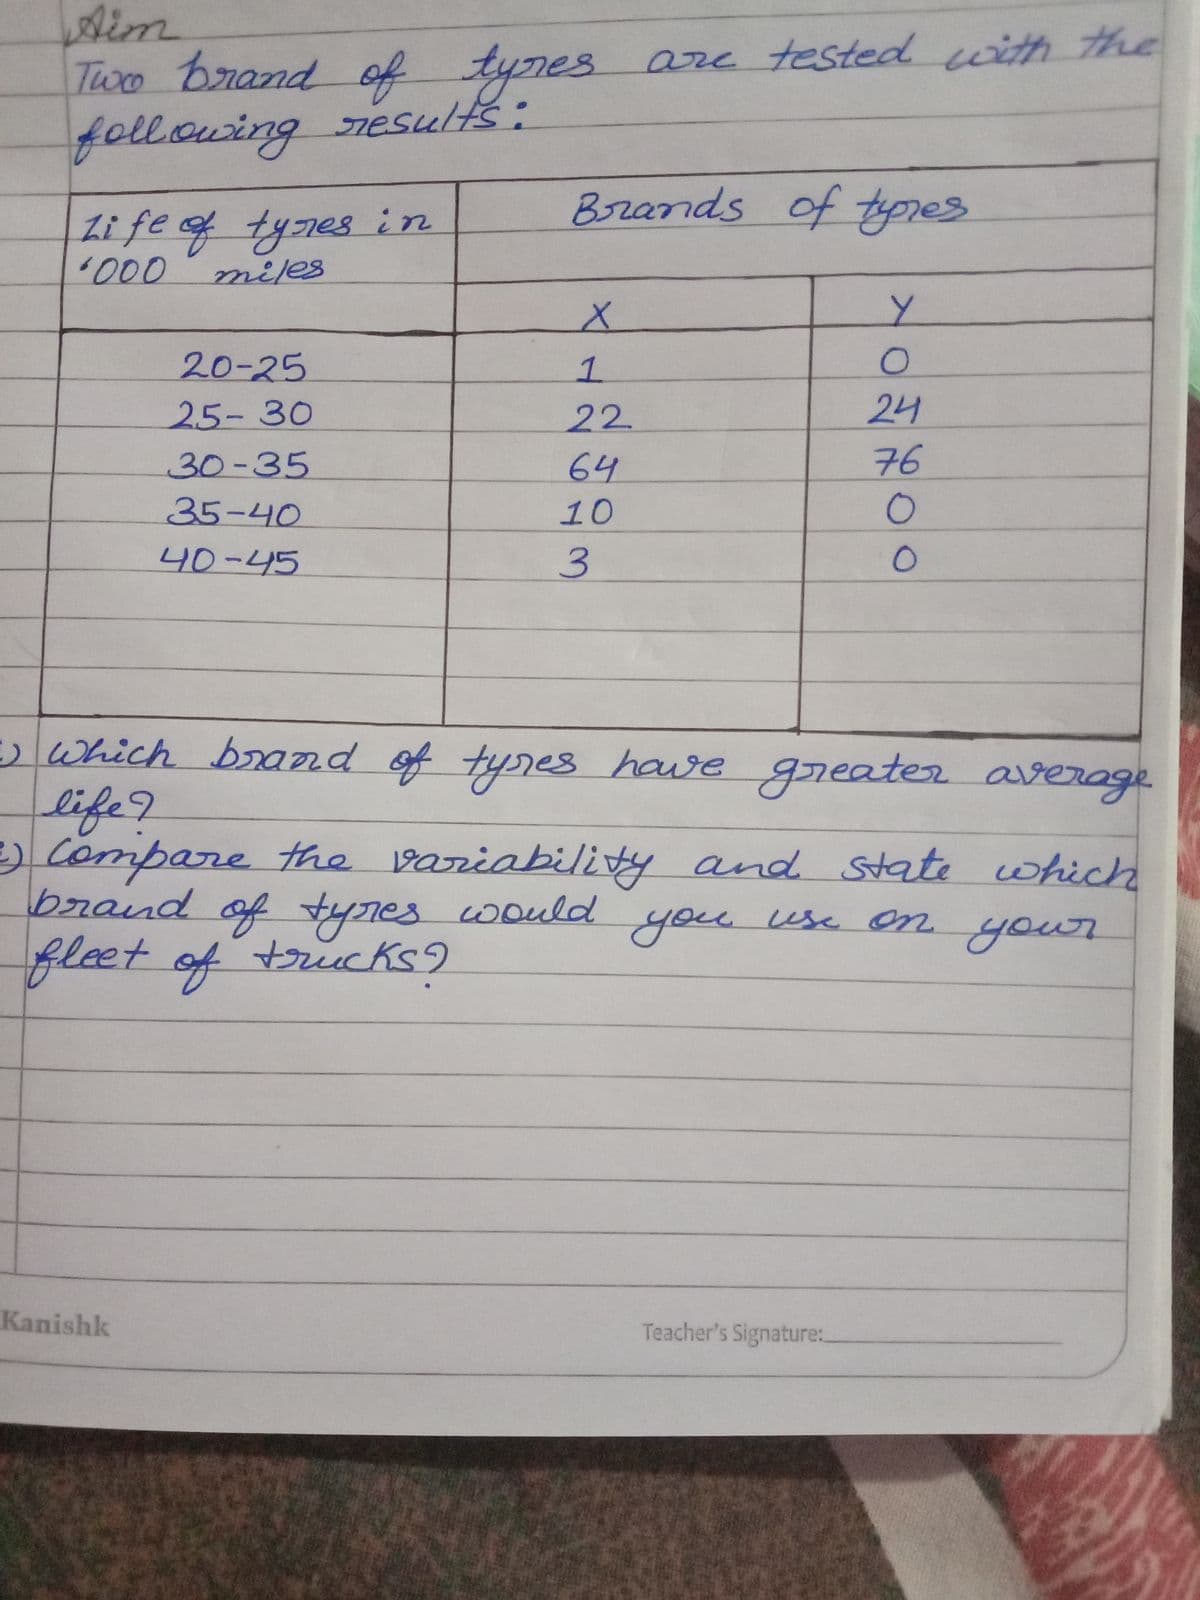
Two brand of tynes are tested with the follouing nesults: Brands of typres Li fe f tynes in 1000 miles X. 20-25 1. 24 76 25- 30 22 30-35 64 35-40 10 40-45 3. Which brand of tynes have greater average life? Compare the variability and state which brand of tynes would fleet of tricks9 you use on your


Q: Your statistics instructor often ponders the relationship between commute time and job satisfaction…
A: The test hypothesis are, H0: The two variables length of commute and job satisfaction are…
Q: The R&D department of a paint company has developed an additive that it hopes will increase the…
A: For the given data Perform t test for one mean
Q: A teacher used the scores of 9 students to identify the variability of students’ performance on the…
A: Here sample size, n= 9 Variability is given by, Var=(summation X^2)/n -{(summationXi)/n}^2
Q: A small random sample of respondents has been selected for a study of the ways that iPhone owners…
A: Given, the data on the percent of battery used by the Starbuck app, Amazon app and Yelp app in the…
Q: You have been asked to find if there is a correlation between the amount of calories per serving in…
A: Note:Hey there! Thank you for posting the question. However, since your question has more than 3…
Q: A consumer testing service obtained the mileages (in miles per gallon) shown in the table on the…
A: Given Car A B C Run 1 28 31 29 Run 2 32 29 32 Run 3 28 31 28 Run 4 30 29 32…
Q: A nursing school professor is interested in determining how her college students compare to the…
A: The sample mean is given by, X¯=∑iXiN=185517=109.117 We have the, Null Hypothesis(H) :…
Q: A developmental psychologist who wanted to see if children who started walking earlier performed…
A: Answer : a) Null and alternative hypothesis: Ho: µ1 = µ2 = µ3 (All means are equal) Ha : Not all…
Q: For mallard ducks and Canada geese, what percentage of nests are successful (at least one offspring…
A: Givenx:percentage success for mallard duck nests41,35,77,26,56y:percentage success for canada goose…
Q: Mr. Acosta, a sociologist, is doing a study to see if there is a relationship between the age of a…
A: The null and alternative hypotheses for the test are: H0: The age and type of movies preferred are…
Q: Following are the quartile values of a data set, The value of Q1 = 25 %3D The value of Q, = 43 %3!…
A: Given : Q1 = 25Q2 = 43Q3 = 43
Q: The following table shows the results of an analysis of variance comparing three treatments. What is…
A: Given that the table shows the results of an analysis of variance comparing three treatments.
Q: A researcher is interested in the effect of climate on the weight of polar bears, and has a dataset…
A: In this study, the researcher is interested to study the effect of climate on the weight of polar…
Q: A developmental psychologist who wanted to see if children who started walking earlier performed…
A:
Q: Which brand of tyres have greater average life? b. Compare the variability and state which brand of…
A: Given, Life (in '000 miles) X Y 20-25 1 0 25-30 22 24 30-35 64 76 35-40 10 0 40-45 3 0
Q: sports psychologist tests a new coaching method and finds that of the 43 novice athletes who were…
A:
Q: What it the mean sales of ice cream for a maximum daily temperature of 93 degrees Fahrenheit.
A: The slope is, b=SSxySSxx=49.28125.2=0.39361 The intercept is,…
Q: Mr. Acosta, a sociologist, is doing a study to see if there is a relationship between the age of a…
A:
Q: b) The following table gives the values of mean and variance of heights and weights of the 10th…
A: Mean and variance of the heights and weights of the 10th standard of a school are given.
Q: Rats were given one of four different diets at random, and the response measure was liver weights as…
A: Please note that as per our guideline we can answer three sub-parts only. Please repost the…
Q: he following data shows the results for 20 students in one of the post graduate unit. 42 66 67 71 78…
A: Order all the values in the data set from smallest to largest. To find the 90th percentile for these…
Q: 12. The following table draws on GSS18SSDS-B data so we can examine the relationship between…
A:
Q: To examine the linear correlation between adult age and weight, data was collected from 9 adults.…
A: We have to test that if the correlation coefficient between two variables is significant.for that we…
Q: A physics tuition teacher claims that the usual practice of going through exercises during the class…
A: The mean difference is tested between the two independent samples are calculated using the t test…
Q: You have been asked to find if there is a correlation between the number of calories per serving in…
A: (a) Use EXCEL to construct the scatter plot. EXCEL procedure: Go to EXCEL Go to Insert menu…
Q: a) Find the value of the chi-square statistic for the sample. (Round the expected frequencies to at…
A:
Q: The speeds of motorists passing a particular point on a motorway are found to be normally…
A: Given that, The percentage of motorists whose speed exceed 120 km/h is,
Q: The owner of a local restaurant with 7 employees made a table of values to show the correlation…
A: In this case, years of experience (x) is the independent variable and hourly wage (y) is the…
Q: A statistic teacher recorded the Math and Science test scores of twelve students from one section.…
A: Data X 18,16,11,15,15,11,11,13,8,9,13,7 Data Y 20,18,12,17,15,14,12,14,10,13,12,9
Q: A woman who has moved into a new house is trying to determine which of two routes to work has the…
A: Note: Thanks for posting the question. We are using the Minitab software to test the given claim.
Q: Mr. Acosta, a sociologist, is doing a study to see if there is a relationship between the age of a…
A: Formula : Test statistic
Q: Which one of the following choices describes a problem for which an analysis of variance would be…
A: Analysis of variance (ANOVA) : when we are testing mean more than 2 groups in that case we use…
Q: Suppose that 67% of college students in Australia use more than 1.65 gigabytes of data on their…
A:
Q: Mika studies if age correlates with the average number of hours of sleep, so she selected a random…
A: Consider that ρ is the population correlation coefficient between Age and Sleep.
Q: A grocery store manager did a study to look at the relationship between the amount of time (in…
A: (1) State the hypotheses. Use EXCEL to obtain the value correlation coefficient r: EXCEL…
Q: In a large department store, the owner wishes to see whether the number of shoplifting incidents per…
A: Given claim: There is a difference in the number of shoplifting incidents before and after the…
Q: (a) What is the level of significance? State the null and alternate hypotheses. H0: Age and movie…
A: As per our guidelines,we are allowed to answer first three sub-parts only. Thanks Given Data :…
Q: A developmental psychologist who wanted to see if children who started walking earlier performed…
A:
Q: If you have a known value of 16, which of the following is the best average of your data to verify…
A: Here We have given a known value of 16 if we go through the option and find their lower and upper…
Q: A program of pet therapy has been running at a local nursing home. Are the participants in the…
A: a) The null and alternative hypotheses for the test are: H0: There is no statistical…
Q: A nursing school professor is interested in determining how her college students compare to the…
A: Note: Since you have posted a question with multiple subparts, we will solve the first three…
Q: The side-by-side dotplot below displays the arm spans, in centimeters, for two classes. Which…
A: The distribution of arm spans for class A are roughly symmetric, and the distribution of arm spans…
Q: Your statistics instructor often ponders the relationship between commute time and job satisfaction…
A: Given, Job Satisfaction Number Who Commute 20 Minutes or Less Number Who Commute 21 to 40…
Q: A medical student at a community college in city Q wants to study the factors affecting the systolic…
A: The test statistic is, t=b1-β1SEb1=0.90-00.55≈1.64 Thus, the test statistic is 1.64. The degrees of…
Q: which of the following data describes different catagories?
A: Here use basic definition of level of measurement
Q: A statistic teacher recorded the Math and Science test scores of twelve students from one section.…
A: Consider, y y^2 20 400 18 324 12 144 17 289 15 225 14 196 12 144 14 196 10 100…
Q: The director of student services at Oxnard College is interested in whether women are less likely to…
A: The data shows orientation attendance and gender.
Q: The general manager of a chain of furniture stores believes that experience is the most important…
A: Scatter plot is used to represent the relation between two variables graphically. If the dots…
Q: Mr. Acosta, a sociologist, is doing a study to see if there is a relationship between the age of a…
A: Given that, Mr. Acosta, a sociologist, is doing a study to see if there is a relationship between…

Step by step
Solved in 3 steps


- In the past decade, two presidential elections in the United States have witnessedvery long wait times at precincts (voting stations) in states that ultimately decidedthe election (Florida in 2000 and Ohio in 2004).In Philadelphia as well, some voters complained about the long lines in someprecincts, with most complaints coming from precinct A. In 2004, the averagenumber of voters arriving at Precinct A was 35 per hour and the arrivals of voterswas random with inter-arrival times that had a coefficient of variation of 1 (CVa=1).Philadelphia deployed 1 voting machine in Precinct A. Suppose that each voterspent on average 100 seconds in the voting booth (this is the time needed to casther/his vote using a voting machine), with a standard deviation of 120 seconds.Q1. How long on average did a voter have to wait in line at precinct A in 2004 beforeentering a booth to cast her/his vote?Given the long wait times for Precinct A, the city of Philadelphia is thinking ofalternative solutions to…In the past decade, two presidential elections in the United States have witnessedvery long wait times at precincts (voting stations) in states that ultimately decidedthe election (Florida in 2000 and Ohio in 2004).In Philadelphia as well, some voters complained about the long lines in someprecincts, with most complaints coming from precinct A. In 2004, the averagenumber of voters arriving at Precinct A was 35 per hour and the arrivals of voterswas random with inter-arrival times that had a coefficient of variation of 1 (CVa=1).Philadelphia deployed 1 voting machine in Precinct A. Suppose that each voterspent on average 100 seconds in the voting booth (this is the time needed to casther/his vote using a voting machine), with a standard deviation of 120 seconds. Q3. Under Proposal 1, at precinct A, what would be the ratio of the average numberof people voting (at a booth) over the average number of people in the line(waiting)? Please show and explain this problem.A certain producer of chocolate has some problems with the variability of five suppliers of cocoa. Since the cocoa quality is critical to the final chocolate product, the company has decided to perform a DOE to compare these suppliers. According to experiences with customers, the capacity of detection of any variation is 3.5 units. Estimate the sample size needed to get at least a power of 85%, given that the historical variance of the process is 2.5 units.
- A researcher randomly sampled 30 graduates of an MBA program and recorded data concerning their starting salaries. Of primary interest to the researcher was the effect of gender on starting salaries. The result of the pooled-variance t-test of the mean salaries of the females (Population 1) and males (Population 2) in the sample is given in the accompanying table. The researcher was attempting to show statistically that the female MBA graduates have a significantly lower mean starting salary than the male MBA graduates. Which of these is an appropriate alternative hypothesis? A. H1:μfemales≠μmales B. H1:μfemales>μmales C. H1:μfemales<μmales D. H1:μfemales=μA lot of 75 washers contains 6 defectives whose variability in thickness is unacceptably large. A sample of 10 washers is selected at random without replacement. a. Calculate the variance of (x)Suppose that in a certain year, it was reported that the variance in GMAT scores was 14,650. At a recent summit, a group of economics professors met to discuss the GMAT performance of undergraduate students majoring in economics. Some expected the variability in GMAT scores achieved by undergraduate economics students to be greater than the variability in GMAT scores of the general population of GMAT takers. However, others took the opposite view. Suppose the following are GMAT scores for 51 randomly selected undergraduate students majoring in economics. 345 749 427 765 336 777 663 451 787 454 711 544 453 330 718 462 585 658 550 576 771 572 629 591 481 574 510 628 532 411 702 640 686 608 510 509 617 576 546 392 512 571 794 690 581 527 329 451 666 377 720 (a) Compute the mean, variance, and standard deviation of the GMAT scores for the 51 observations. (Round your answers to two decimal places.) x=s2=s= (b) Develop hypotheses to test whether…
- Suppose that in a certain year, it was reported that the variance in GMAT scores was 14,650. At a recent summit, a group of economics professors met to discuss the GMAT performance of undergraduate students majoring in economics. Some expected the variability in GMAT scores achieved by undergraduate economics students to be greater than the variability in GMAT scores of the general population of GMAT takers. However, others took the opposite view. Suppose the following are GMAT scores for 51 randomly selected undergraduate students majoring in economics. 345 749 427 767 336 777 663 451 787 454 711 544 453 330 718 462 585 658 550 576 773 572 629 591 481 574 510 628 532 411 702 640 686 608 510 509 617 576 546 392 512 573 794 690 581 527 329 451 666 377 720 (a) Compute the mean, variance, and standard deviation of the GMAT scores for the 51 observations. (Round your answers to two decimal places.) x= ( ) s2=( ) s= ( ) (b) Develop hypotheses…A random sample of 20 newly-born baby boys showed an average weight of 7.40 pounds while a sample of 25 newly-born baby girls showed a mean weight of 6.50 pounds. If the variance of all newly-born babies are 1.25 pounds, can we say that newly-born baby boys are heavier than newly-born baby girls using the 0.05 level?A researcher wants to examine different online teaching environments by collecting data on 20 students. Half of the students had synchronous class while the other half had asynchronous class. For the students who had the synchronous class, they scored an average of 80 on the final exam with a sample variance of 10. For the students who had the asynchronous class, they scored an average of 78 on the final exam with a sample variance of 18. Determine if there is a significant difference between the average final exam score between the two groups of students. Use a significance level of 5%. What is the alternative hypothesis? Group of answer choices: A.The average final exam score for the asynchronous class is higher than the synchronous class. B. There is no difference in the average final exam score between the asynchronous class and synchronous class. C. There is a difference in the average final exam score between the asynchronous class and synchronous class. D. The…
- A researcher wants to examine different online teaching environments by collecting data on 20 students. Half of the students had synchronous class while the other half had asynchronous class. For the students who had the synchronous class, they scored an average of 80 on the final exam with a sample variance of 10. For the students who had the asynchronous class, they scored an average of 78 on the final exam with a sample variance of 18. Determine if there is a significant difference between the average final exam score between the two groups of students. Use a significance level of 5%. What is the null hypothesis? Group of answer choices: A.) The average final exam score for the asynchronous class is higher than the synchronous class. B.) There is a difference in the average final exam score between the asynchronous class and synchronous class. C.) The average final exam score for the asynchronous class is lower than the synchronous class. D.) There is no difference in the…a sample of 9 days over the past six months showed that a dentist treated the following numbers of patients: 22, 25, 20, 18, 15, 22, 24, 19, and 26. if the number of patientsseen per day is normally distributed, would an analysis of these sample data reject thehypothesis that the variance in the number of patients seen per day is equal to 10? use a.10 level of significance. what is your conclusion?To find out whether a new serum will arrest leukemia, 9 mice, all with an advanced state of the disease are selected. Five mice receive the treatment and 4 do not. Survival times, in years, from the time the experiment commenced are provided. At the .01 level of significance, can the serum be said to be effective. Assue the populations to be normally distributed with equal variances. Let sample 1 be the mice that recieved the treatment and sample 2 be the mice that did not receive treatment . State the null and alternative hypotheses. Survival times (yrs) Treatment 2.1 5.5 1.2 4.4 0.7 Non-treatment 1.9 0.6 2.6 3.3 Identify the critical region. Determine the test statistic State the proper conclusion.


