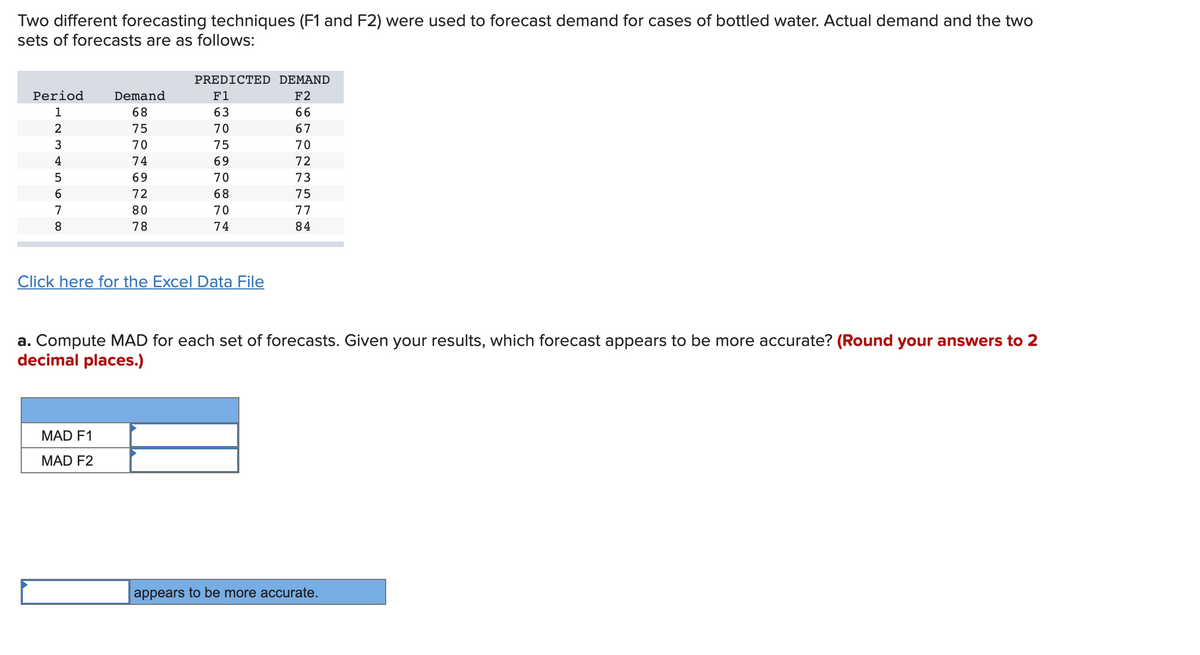
Two different forecasting techniques (F1 and F2) were used to forecast demand for cases of bottled water. Actual demand and the two sets of forecasts are as follows: PREDICTED DEMAND Period Demand F1 F2 1 68 63 66 75 70 67 3 70 75 70 4 74 69 72 69 70 73 6. 72 68 75 7. 80 70 77 8. 78 74 84 Click here for the Excel Data File a. Compute MAD for each set of forecasts. Given your results, which forecast appears to be more accurate? (Round your answers to 2 decimal places.) MAD F1 MAD F2 appears to be more accurate.


Q: The followng table shows the actual demand observed over the last 11 years: Year 1 2 3 4 7 8 10 11…
A: Given: The weights are 0.15, 0.35 and 0.50. 0.50 is for the most recent period. The provided data…
Q: The Manager of a towel company needs to accurately forecast the demand for towels. If the supply of…
A: Forecasting
Q: Here are the data for the past 21 months for actual sales of a particular product: LAST YEAR THIS…
A: See the handwritten solution
Q: 14. Given the following data for demand at the XYZ Company, calculate the monthly forecast using a…
A: The objective is to calculate the forecast error, absolute deviation, mean absolute deviation, bias…
Q: Apply the 3-years moving average method to forecast the required demand for the year 2021 from the…
A: Solution : Given data is Years 2012 2013 2014 2015 2016 2017 2018 2019 2020 Demand 245 325 300…
Q: Given the following demand for ten-period time frame as shown in the table below. Compute the…
A: For the given data Compute the three-period and five-period moving average forecasts. Plot the…
Q: Toward the middle of the harvesting season, peaches for canning come in three types, early, late,…
A: Assume, E be the set representing the trucks carried early peaches and n(E) be the number of…
Q: Shan Foods estimated the following demand equation for its product using data from 26 supermarkets…
A: Since you have posted multiple questions, we will answer only some of them. Kindly mention…
Q: This exercise is based on the following data on three bodybuilding supplements. (Figures shown…
A:
Q: The following table shows the total spent on research and development by industry in a country, in…
A: From the given information, t ln(t) S(t) 2 0.693147 193 3 1.098612 196 4 1.386294 196 5…
Q: Q 20: year mile hour 2001 4000 200 2002 4400 220 2003 2000 100 2004 3000 120 2005 4800 240 2006 5200…
A:
Q: (a) For the following data, verify that the 5 year weighted moving average with weights 1, 2, 2, 2,…
A:
Q: Below is a table of data that have been collected Price,p,($) Weekly Demand,s,(1,000s) 150 210 170…
A: Given Data: Price Weekly Demand 150 210 170 203 190 199 210 183 230 185 250 176…
Q: Use the following data to answer the following problems Year Quarter Sales 2 3 3 1 2 3 1 2 3 55 58…
A: Step 1: Unstack columns by quarter: Go to Data > Unstack columns then new window is opened as…
Q: The following demand data is given for Glass Inc Company. They want to forecast the demands for all…
A: Given information: The demand data for Glass Inc Company is provided as: Period (t) Demand (Dt)…
Q: A company has the following demand history for six months: Month Demand January February 214 226…
A: The symmetric mean absolute percent errors (SMAPE) is given as, SMPAE=100%n∑i=1nFt-AtAt+Ft2 Using…
Q: Data collected on the yearly demand for 50-pound bags of fertilizer at Wallace Garden Supply are…
A: In statistics, a moving average is a calculation used to analyze data points by creating a series of…
Q: Find the equation of the regression line from the following data. Price of a Commodity in RO 1 3…
A: Solution: Let X be the price of a commodity in RO and Y be the demand for the commodity. The given…
Q: The sales (in millions of dollars) for an 18-month period are as follows. Month Sales Month Sales 1…
A: Forecasting of time series data is done to predict the value for the future using the past trends.…
Q: Fruit prices and the amounts consumed for 2010 and 2018 are shown. Use 2010 as the base. 2010 2018…
A: The index number concept plays a vital role in daily life, it helps us to finding the changes in the…
Q: b) For the following data, verify that the 5 year weighted moving average with weights 1, 2, 2, 2, 1…
A: For the following data, verify that the 5 year weighted moving average with weights 1, 2,2, 2, 1…
Q: The following data lists different investment amounts (X) and the amount of interest (Y): X5 Y 2.5…
A: Here is the solution:
Q: This is the following demand data: Period Demand 1 40 2 55 60 4 35 30 6. 52
A: Given information: The data represents the values of demand for the time periods 1 through 8.
Q: Past sales for months 1 to 5 of a large equipment are shown below. Month 1 2 3 4 5 Actual Demands 12…
A: From the given information we forecast for 6 using least squared equation
Q: The manager of a salmon cannery suspects that the demand for her product is closely related to the…
A: (a) Use EXCEL to construct the scatter plot. EXCEL procedure: Go to EXCEL Go to Insert menu…
Q: The Manager of a towel company needs to accurately forecast the demand for towels. If the supply of…
A: image is attached with detailed solution.
Q: Shan Foods estimated the following demand equation for its product using data from 26 supermarkets…
A:
Q: The problem is based on the following data given. Observations of the demand for a certain part…
A: The forecasts for July through December 2013 are: July: 206, August: -225, September: 242, October:…
Q: Two different forecasting techniques (F1 and F2) were used to forecast demand for cases of bottled…
A: we need to find MSE and MAPE MSE = Average(dev^2) = 253/8 = 31.62 MAPE = Average((abs…
Q: Consider the following quarterly demand level for electricity (in 1000 megawatts) in Mankweng from…
A: Given, Quarterly demand level of electricity is given in below table: Year /…
Q: Consider the following quarterly demand level for electricity (in 1000 megawatts) in Mankweng from…
A: Hello! As you have posted more than 3 sub parts, we are answering the first 3 sub-parts. In case…
Q: Two different forecasting techniques (F1 and F2) were used to forecast demand for cases of bottled…
A:
Q: Calculate Mode from the following data: Class 0-5 5-10 10-15 15-20 20-25 F 2 3 2.
A: Given data: Class Frequency 0 - 5 1 5 - 10 2 10 - 15 3 15 - 20 2 20 - 25 1 Total n =…
Q: Consider the following actual demand and forecast data for ARX AG a national distributor of…
A:
Q: Given the following data on the number of pints of ice cream sold at a local ice cream store for a…
A: The moving average method is to be used to find the forecast for time period 11, using the…
Q: For the data set, perform exponential smoothing with alpha = 0.1 to determine the forecast for week…
A: Given data and forecast for the following week is shown here
Q: Table 2. Total oil production in millions of tons for Saudi Arabia from 1996-2013 Forecast Demand,…
A: The forecasting for the total oil production (in millions) is to be concluded using the simple…
Q: The following data lists different investment amounts (X) and the amount of interest (Y): X5 Y 10 20…
A: Solution-: Given data: Let, X=Investment amount and Y=Amount of interest X Y 5 2.5 10 5 20…
Q: Compare the primary types of forecasting methods used to determine demand.
A: Human resource development helps to train a person after they are hired and provides opportunities…
Q: Data collected on the yearly demand for 50-pound bags of fertilizer at Wallace Garden Supply are…
A:
Q: When people were asked how much money they spent yesterday (in dollars), th was their data: 20 1 34…
A: Hi! Thank you for the question, As per the honor code, we are allowed to answer one question at a…
Q: The following are historical demand data: ACTUAL YEAR SEASON DEMAND 2 years ago Spring 205 Summer…
A: Seasonal index is measured in terms of index. It is calculating the average of all the data which…
Q: Consider the following quarterly demand level for electricity (in 1000 megawatts) in Mankweng from…
A: Hello! As you have posted more than 3 sub parts, we are answering the first 3 sub-parts. In case…
Q: The problem is based on the following data given. Observations of the demand for a certain part…
A: Given data Month Demand Jan 89 Feb 57 mar 144 April 221 may 177 June 280 July 223…
Q: The customer demand for a particular smart phone during Year 0 to Year 5 is given as 1,056,000,…
A: Using the Holt forecasting model with trend as,…
Q: Given the following data on the number of pints of ice cream sold at a local ice cream store for a…
A: Given To find forecast demand for period 11 using 2-period moving average,
Q: Provide a bar chart (with data labels rounded to two decimal points) showing the average demand for…
A: Consider the following table:- Weekday Date Sum of Daily Demand Average Mon…


Trending now
This is a popular solution!

Step by step
Solved in 3 steps with 3 images

- Find the equation of the regression line for the following data set. x 1 2 3 y 0 3 4Urban Travel Times Population of cities and driving times are related, as shown in the accompanying table, which shows the 1960 population N, in thousands, for several cities, together with the average time T, in minutes, sent by residents driving to work. City Population N Driving time T Los Angeles 6489 16.8 Pittsburgh 1804 12.6 Washington 1808 14.3 Hutchinson 38 6.1 Nashville 347 10.8 Tallahassee 48 7.3 An analysis of these data, along with data from 17 other cities in the United States and Canada, led to a power model of average driving time as a function of population. a Construct a power model of driving time in minutes as a function of population measured in thousands b Is average driving time in Pittsburgh more or less than would be expected from its population? c If you wish to move to a smaller city to reduce your average driving time to work by 25, how much smaller should the city be?In the packaging department of a large aircraft parts distributor, a fairly reliable estimate ofpackaging and processing costs can be determined by knowing the weight of an order. Thus, theweight is a cost driver that accounts for a sizable fraction of the packaging and processing costsat this company. Data for the past 10 orders are given as follows:
- Because of high tuition costs at state and private universities, enrollments atcommunity colleges have increased dramatically in recent years. The following data show theenrollment (in thousands) for Jefferson Community College from 2001–2009:Year Period (t) Enrollment (1000s)2001 1 6.52002 2 8.12003 3 8.42004 4 10.22005 5 12.52006 6 13.32007 7 13.72008 8 17.22009 9 18.1Compute F10: the Forecast for 2010. Compute Pearson’s Correlation Coefficient Use the Method of Least Squares to obtain the Best-Fit-Line for this data. Use the line to compute the forecast.The demand and forecast information for the XYZ Company over a twelve-month period has been collected in the Microsoft Excel Online file below. Use the Microsoft Excel Online file below to develop forecast accuracy and answer the following questions. Forecast Accuracy Measures Period Actual Demand Forecast Error Absolute Error Error^2 Abs. % Error 1 1,300 1,378 2 2,000 1,676 3 1,800 1,974 4 1,700 2,272 5 2,300 2,570 6 3,800 2,868 7 3,200 3,166 8 3,100 3,464 9 3,900 3,761 10 4,600 4,059 11 4,200 4,357 12 4,300 4,655 Total Average RSFE MAD MSE MAPE Tracking Signal 1. What can be concluded about the quality of the forecasts? Assume that the control limit for the tracking signal is ±3. The results indicate (bias or no bias) in the…The production planning period for flat-screen moni-tors at Louisiana’s Roa Electronics, Inc., is 4 months. Cost data are as follows:Regular-time cost per monitor $ 70Overtime cost per monitor $110Subcontract cost per monitor $120Carrying cost per monitor per month $ 4 For each of the next 4 months, capacity and demand for flat-screen monitors are as follows: PERIOD MONTH 1 MONTH 2 MONTH 3 a MONTH 4Demand 2,000 2,500 1,500 2,100CapacityRegular time 1,500 1,600 750 1,600Overtime 400 400 200 400Subcontract 600 600 600 600aFactory closes for 2 weeks of vacation.CEO Mohan Roa expects to enter the planning period with 500monitors in stock. Back ordering is not permitted (meaning, forexample, that monitors produced in the second month cannot beused to cover first month’s demand). Develop a production planthat minimizes costs using the transportation method.
- ABC Company has decided to use 20 test markets to examine the sensitivity of demand for its new product, Hand Sanitizer, to various prices, as shown in the following table. Each market had approximately the same level of business activity and population. Test Market Quantity sold (Thousands of Pens) Price Charged (cent) 1 20 50 2 21 50 3 19 55 4 18 60 5 20 60 6 14 65 7 16 65 8 20 70 9 12 70 10 14 80 11 12 70 12 10 70 13 14 65 14 16 90 15 18 45 16 16 70 17 20 65 18 12 80 19 18 70 20 10 50 Q.1. Using a linear regression model, estimate the demand function for ABC Company’s new product, Hand sanitizer. Q.2. Interpret the coefficient value of the independent variable of the estimated demand function. Q.3. What will be the predicted/estimated sale for each price shown in column 2? Q.4. Find the prediction interval at…Toward the middle of the harvesting season, peaches for canning come in three types, early, late, and extra late, depending on the expected date of ripening. During a certain week, the data to the right were recorded at a fruit delivery station. Complete parts (a) through (d) below. 40 trucks went out carrying early peaches; 71 carried late peaches; 52 carried extra late peaches; 26 carried early and late; 32 carried late and extra late; 11 carried early and extra late; 6 carried all three; 5 carried only figs (no peaches at all). a) How many trucks carried only late variety peaches? trucks (Type a whole number.) (b) How many carried only extra late? trucks (Type a whole number.) (c) How many carried only one type of peach? trucks (Type a whole number.) (d)How many trucks (in all) went out during the week? trucks (Type a whole number.)IOG Technologies offers semiconductor and system solutions for automotive industrial and multimarket sectors for applications in communication. The following data relates to the production of three products manufactured by them: Product Price (RM) Quantity 2000 2016 2000 2016 BD-1005 3.00 3.20 60 80 LCM-2134 2.00 2.50 100 90 DDK-456 3.50 4.00 500 700 Determine the Laspeyres Price Index (LPI) and Paasche Price Index (PPI) for 2016 using 2000 as the base period.
- Given the following data on the number of pints of ice cream sold at a local ice cream store for a 10-period time frame period. Demand 1 200 2 245 3 190 4 270 5 280 6 300 7 320 8 340 9 320 10 280 Use a 2-period moving average to forecast demand for period 11 Group of answer choices 310 330 300 290Toward the middle of the harvesting season, peaches for canning come in three types, early, late, and extra late, depending on the expected date of ripening. During a certain week, the data to the right were recorded at a fruit delivery station. Complete parts (a) through (d) below. 40 trucks went out carrying early peaches; 76 carried late peaches; 64 carried extra late peaches; 31 carried early and late; 34 carried late and extra late; 13 carried early and extra late; 6 carried all three; 8 carried only figs (no peaches at all). a. How many trucks carried only late variety peaches? b. How many carried only extra late? c. How many carried only one type of peach? d. How many trucks (in all) went out during the week? Thank you so muchYou have been presented with the following data and asked to fit statisti¬cal demand functions: REGION SALES (Y)(‘000 gallons) ADVERTISING EXPENSES (A)($’000) SELLING PRICE (P)($/gallon) DISPOSABLE INCOME (M)($’000)1 160 150 15.00 19.02 220 160 13.50 17.53 140 50 16.50 14.04 190 190 14.50 21.05 130 90 17.00 15.56 160 60 16.00 14.57 200 140 13.00 21.58 150 110 18.00 18.09 210 200 12.00 18.510 190 100 15.50 20.0 Use any multiple regression packages to estimate a linear relationship between the dependent variable and the independent variables. Use any multiple regression packages to estimate a linear relationship between the dependent variable and the independent variables. a. Linear Relationshipi. Identify the dependent and independent variables.ii. Estimate a linear relationship between the dependent variable and all the independent variables.…
