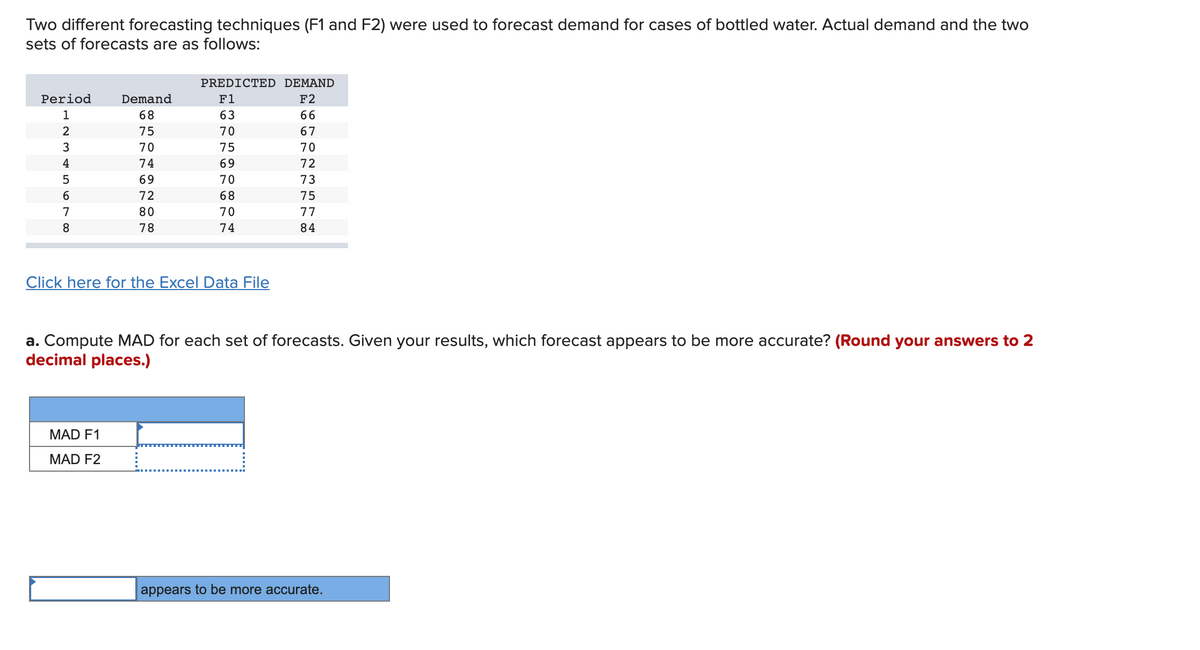
Two different forecasting techniques (F1 and F2) were used to forecast demand for cases of bottled water. Actual demand and the two sets of forecasts are as follows: TTTT PREDICTED DEMAND Period Demand F1 F2 1 68 63 66 2 75 70 67 70 75 70 74 69 72 69 70 73 72 68 75 80 70 77 78 74 84 Click here for the Excel Data File a. Compute MAD for each set of forecasts. Given your results, which forecast appears to be more accurate? (Round your answers to 2 decimal places.) MAD F1 MAD F2


Q: The number of pounds of steam used per month by a chemical plant is thought to be related to the…
A: Simple linear Regression model : Linear Regression analysis is used to measure the association or…
Q: The followng table shows the actual demand observed over the last 11 years: Year 1 2 3 4 7 8 10 11…
A: Given: The weights are 0.15, 0.35 and 0.50. 0.50 is for the most recent period. The provided data…
Q: Given the following data for demand at the XYZ Company, calculate the monthly forecast for 2003…
A: Forecast are used to determine the future value over a period of time. Error in forecast can be…
Q: carpet manufacturing cleaning company has a seasonal pattern of daily mail volume every week. The…
A: Data given for week 1 & 2 We have to forcast the volume for each day of week if 30,000 piece to…
Q: Apply the 3-years moving average method to forecast the required demand for the year 2021 from the…
A: Solution : Given data is Years 2012 2013 2014 2015 2016 2017 2018 2019 2020 Demand 245 325 300…
Q: As concrete cures it gains strength. The following data represents the 7 day and 28 day Ustrength…
A: Given: The data given is as follows x y 2300 4070 3390 5220 2430 4640 2890 4620 3330…
Q: From the following data, compute i. Laspeyre’s price index ii. Paasche’s price index Commodity…
A: Commodity Base Commodity Base Current period Current period Price (K) Quantity (Kg) Price (K)…
Q: Data collected from the economy of Cardtown reveals that a 16% increase in income leads to the…
A:
Q: Given the following demand for ten-period time frame as shown in the table below. Compute the…
A: For the given data Compute the three-period and five-period moving average forecasts. Plot the…
Q: Shan Foods estimated the following demand equation for its product using data from 26 supermarkets…
A: Since you have posted multiple questions, we will answer only some of them. Kindly mention…
Q: Determine the slope of the Age Dependency Ratio equation and explain the meaning of the slope in a…
A: It is given that the all 3 dependency ratio. The line equation for Age dependency ratio is y =1.43 x…
Q: The following table shows the total spent on research and development by industry in a country, in…
A: From the given information, t ln(t) S(t) 2 0.693147 193 3 1.098612 196 4 1.386294 196 5…
Q: Q 20: year mile hour 2001 4000 200 2002 4400 220 2003 2000 100 2004 3000 120 2005 4800 240 2006 5200…
A:
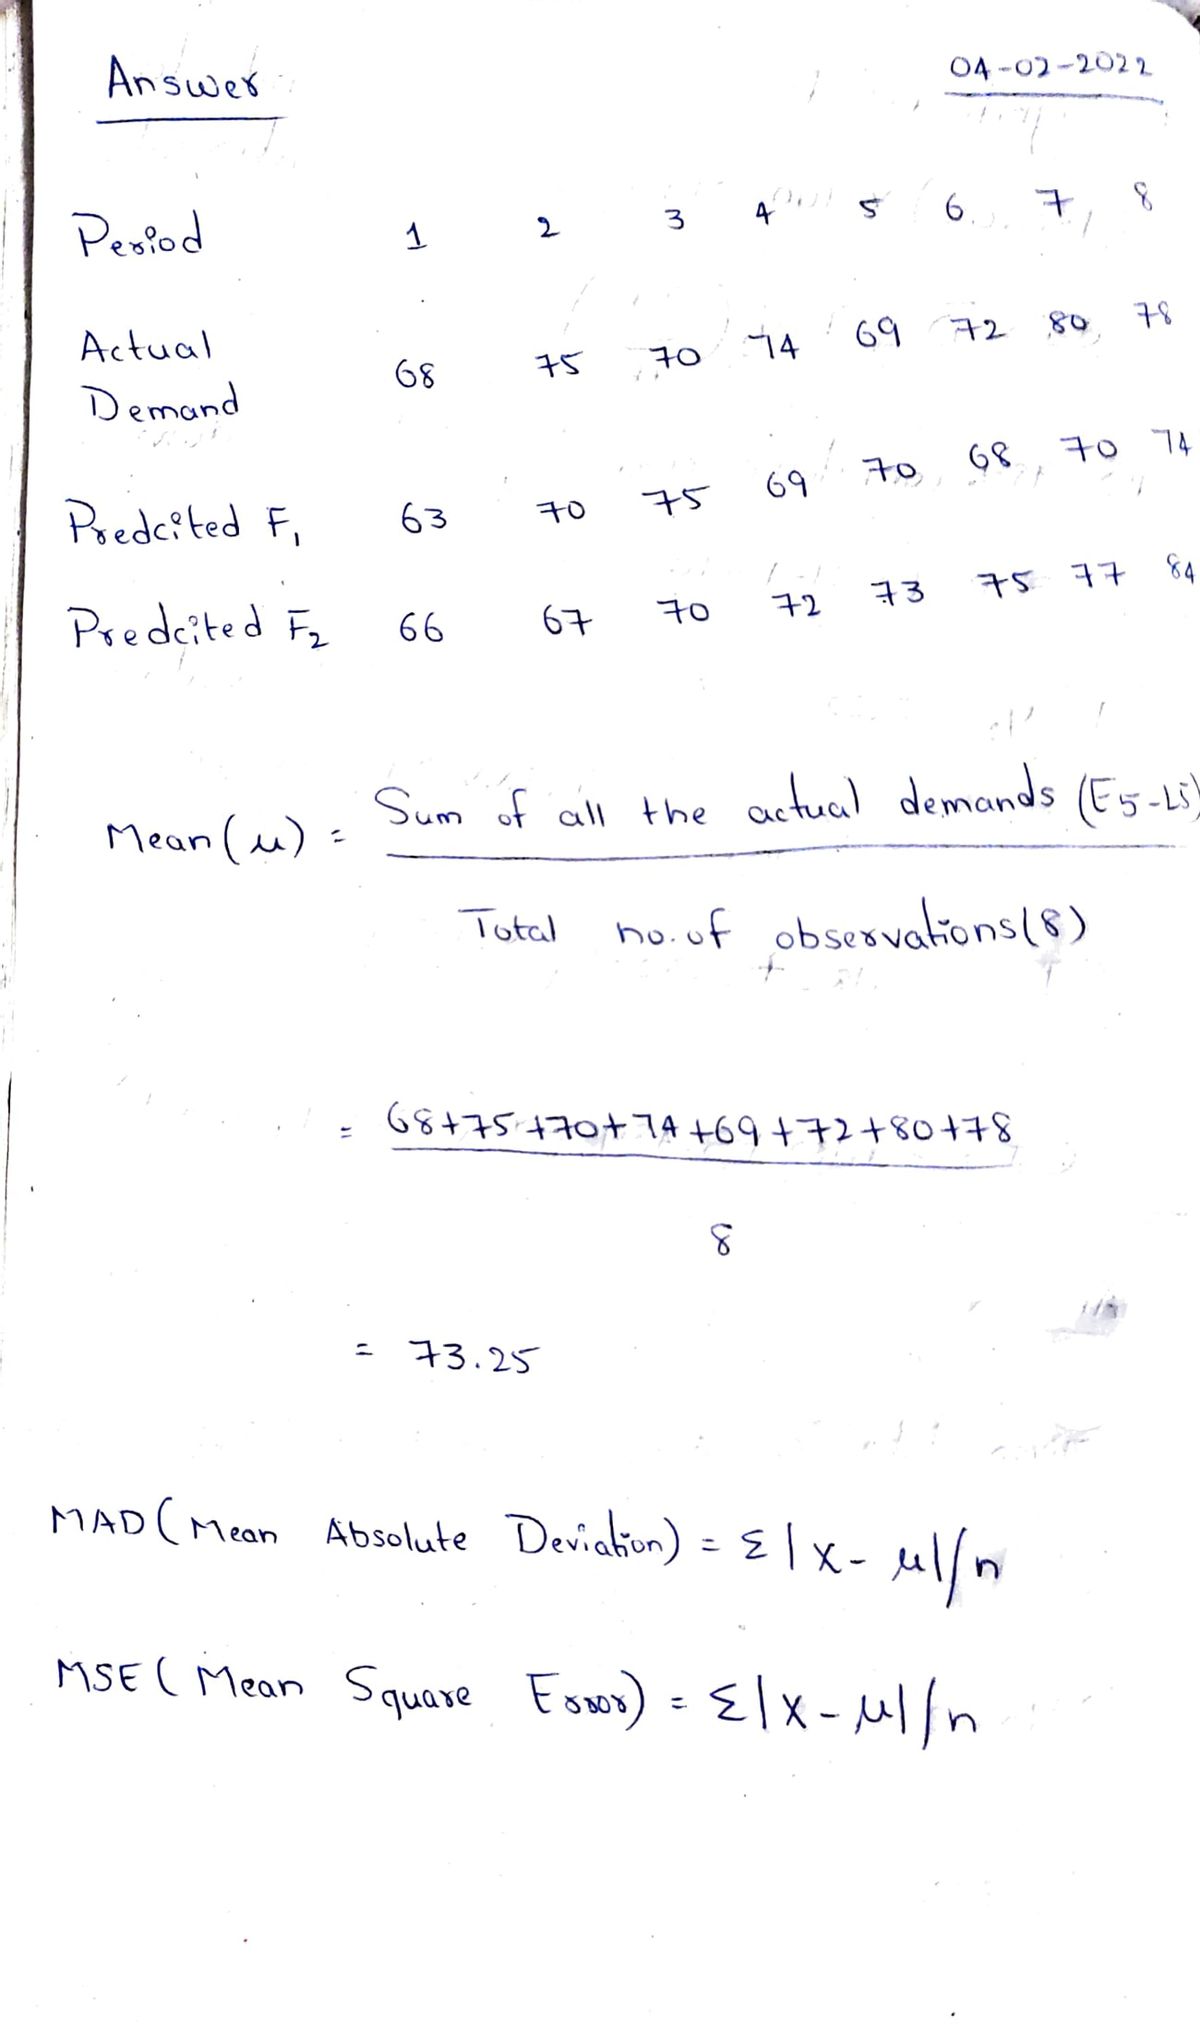
Q: Two different forecasting techniques (F1 and F2) were used to forecast demand for cases of bottled…
A: We will proceed into this way
Q: The following demand data is given for Glass Inc Company. They want to forecast the demands for all…
A: Given information: The demand data for Glass Inc Company is provided as: Period (t) Demand (Dt)…
Q: A company has the following demand history for six months: Month Demand January February 214 226…
A: The symmetric mean absolute percent errors (SMAPE) is given as, SMPAE=100%n∑i=1nFt-AtAt+Ft2 Using…
Q: Data collected on the yearly demand for 50-pound bags of fertilizer at Wallace Garden Supply are…
A: In statistics, a moving average is a calculation used to analyze data points by creating a series of…
Q: Find the equation of the regression line from the following data. Price of a Commodity in RO 1 3…
A: Solution: Let X be the price of a commodity in RO and Y be the demand for the commodity. The given…
Q: The sales (in millions of dollars) for an 18-month period are as follows. Month Sales Month Sales 1…
A: Forecasting of time series data is done to predict the value for the future using the past trends.…
Q: XYZ Company, Annual Data Actual Demand. Forecasted Demand 15 14 15…
A: The formula for mean absolute deviation is MAD = (Σ|At – Ft|)/n, where At is the actual value and Ft…
Q: QOCH.C The number of cell phones per 100 residents in countries in Europe is given in Table #1 for…
A: For Cell Phones per 100 Residents in Europe: Sample x1 (x1-x̄1)^2 1 100 66.4225 2 112…
Q: The following data lists different investment amounts (X) and the amount of interest (Y): X5 Y 2.5…
A: Here is the solution:
Q: The Monthly demand for unit manufactured by the ABC Company has been as follows: Units 250 290 240…
A: Here, we are provided with a monthly data. Now, we know that, 4 weeks constitute of a month.…
Q: This is the following demand data: Period Demand 1 40 2 55 60 4 35 30 6. 52
A: Given information: The data represents the values of demand for the time periods 1 through 8.
Q: The Manager of a towel company needs to accurately forecast the demand for towels. If the supply of…
A: image is attached with detailed solution.
Q: Shan Foods estimated the following demand equation for its product using data from 26 supermarkets…
A:
Q: The problem is based on the following data given. Observations of the demand for a certain part…
A: The forecasts for July through December 2013 are: July: 206, August: -225, September: 242, October:…
Q: The distribution of daily demand for rental trucks at a vehicle rental company is shown in the…
A:
Q: Two different forecasting techniques (F1 and F2) were used to forecast demand for cases of bottled…
A: we need to find MSE and MAPE MSE = Average(dev^2) = 253/8 = 31.62 MAPE = Average((abs…
Q: The boxplots show data for state and local community expenditures on police and fire protection.…
A:
Q: Calculate the critical value and the degrees of freedom Set up your equation and find the answers.…
A: Here degrees of freedom are (3-1)*(2-1)=3 Hence critical value at 5% level of significance and with…
Q: Consider the following quarterly demand level for electricity (in 1000 megawatts) in Mankweng from…
A: Hello! As you have posted more than 3 sub parts, we are answering the first 3 sub-parts. In case…
Q: The following are historical demand data: YEAR SEASON ACTUAL DEMAND 2 years ago Spring 205…
A: Solution: The historical demand data is given. It is asked to use the regression analysis on…
Q: Calculate Mode from the following data: Class 0-5 5-10 10-15 15-20 20-25 F 2 3 2.
A: Given data: Class Frequency 0 - 5 1 5 - 10 2 10 - 15 3 15 - 20 2 20 - 25 1 Total n =…
Q: The following table shows retail sales in drug stores in billions of dollars in the U.S. for years…
A: In multiple linear regression, there will be more than one independent variable. In simple linear…
Q: Consider the following actual demand and forecast data for ARX AG a national distributor of…
A:
Q: For the data set, perform exponential smoothing with alpha = 0.1 to determine the forecast for week…
A: Given data and forecast for the following week is shown here
Q: Table 2. Total oil production in millions of tons for Saudi Arabia from 1996-2013 Forecast Demand,…
A: The forecasting for the total oil production (in millions) is to be concluded using the simple…
Q: The following data lists different investment amounts (X) and the amount of interest (Y): X5 Y 10 20…
A: Solution-: Given data: Let, X=Investment amount and Y=Amount of interest X Y 5 2.5 10 5 20…
Q: and visual streams streams, in billions, is given in the following table for 2014-2019. 2019 2018…
A: To Determine:
Q: Data collected on the yearly demand for 50-pound bags of fertilizer at Wallace Garden Supply are…
A:
Q: When people were asked how much money they spent yesterday (in dollars), th was their data: 20 1 34…
A: Hi! Thank you for the question, As per the honor code, we are allowed to answer one question at a…
Q: The following are historical demand data: ACTUAL YEAR SEASON DEMAND 2 years ago Spring 205 Summer…
A: Seasonal index is measured in terms of index. It is calculating the average of all the data which…
Q: The problem is based on the following data given. Observations of the demand for a certain part…
A: Given data Month Demand Jan 89 Feb 57 mar 144 April 221 may 177 June 280 July 223…
Q: A Juarez, Mexico, manufacturer of roofing supplies has developed monthly forecasts for a family of…
A:
Q: Given the following data on the number of pints of ice cream sold at a local ice cream store for a…
A: Given To find forecast demand for period 11 using 2-period moving average,
Q: Provide a bar chart (with data labels rounded to two decimal points) showing the average demand for…
A: Consider the following table:- Weekday Date Sum of Daily Demand Average Mon…
Q: 1.The five week demand forecasts are given in the following table: Week Demand 1 4 3 360 220 260 140…
A:

Trending now
This is a popular solution!

Step by step
Solved in 4 steps with 4 images

- Find the equation of the regression line for the following data set. x 1 2 3 y 0 3 4In the packaging department of a large aircraft parts distributor, a fairly reliable estimate ofpackaging and processing costs can be determined by knowing the weight of an order. Thus, theweight is a cost driver that accounts for a sizable fraction of the packaging and processing costsat this company. Data for the past 10 orders are given as follows:Because of high tuition costs at state and private universities, enrollments atcommunity colleges have increased dramatically in recent years. The following data show theenrollment (in thousands) for Jefferson Community College from 2001–2009:Year Period (t) Enrollment (1000s)2001 1 6.52002 2 8.12003 3 8.42004 4 10.22005 5 12.52006 6 13.32007 7 13.72008 8 17.22009 9 18.1Compute F10: the Forecast for 2010. Compute Pearson’s Correlation Coefficient Use the Method of Least Squares to obtain the Best-Fit-Line for this data. Use the line to compute the forecast.
- The demand and forecast information for the XYZ Company over a twelve-month period has been collected in the Microsoft Excel Online file below. Use the Microsoft Excel Online file below to develop forecast accuracy and answer the following questions. Forecast Accuracy Measures Period Actual Demand Forecast Error Absolute Error Error^2 Abs. % Error 1 1,300 1,378 2 2,000 1,676 3 1,800 1,974 4 1,700 2,272 5 2,300 2,570 6 3,800 2,868 7 3,200 3,166 8 3,100 3,464 9 3,900 3,761 10 4,600 4,059 11 4,200 4,357 12 4,300 4,655 Total Average RSFE MAD MSE MAPE Tracking Signal 1. What can be concluded about the quality of the forecasts? Assume that the control limit for the tracking signal is ±3. The results indicate (bias or no bias) in the…Toward the middle of the harvesting season, peaches for canning come in three types, early, late, and extra late, depending on the expected date of ripening. During a certain week, the data to the right were recorded at a fruit delivery station. Complete parts (a) through (d) below. 40 trucks went out carrying early peaches; 71 carried late peaches; 52 carried extra late peaches; 26 carried early and late; 32 carried late and extra late; 11 carried early and extra late; 6 carried all three; 5 carried only figs (no peaches at all). a) How many trucks carried only late variety peaches? trucks (Type a whole number.) (b) How many carried only extra late? trucks (Type a whole number.) (c) How many carried only one type of peach? trucks (Type a whole number.) (d)How many trucks (in all) went out during the week? trucks (Type a whole number.)Toward the middle of the harvesting season, peaches for canning come in three types, early, late, and extra late, depending on the expected date of ripening. During a certain week, the data to the right were recorded at a fruit delivery station. Complete parts (a) through (d) below. 40 trucks went out carrying early peaches; 76 carried late peaches; 64 carried extra late peaches; 31 carried early and late; 34 carried late and extra late; 13 carried early and extra late; 6 carried all three; 8 carried only figs (no peaches at all). a. How many trucks carried only late variety peaches? b. How many carried only extra late? c. How many carried only one type of peach? d. How many trucks (in all) went out during the week? Thank you so much
- IOG Technologies offers semiconductor and system solutions for automotive industrial and multimarket sectors for applications in communication. The following data relates to the production of three products manufactured by them: Product Price (RM) Quantity 2000 2016 2000 2016 BD-1005 3.00 3.20 60 80 LCM-2134 2.00 2.50 100 90 DDK-456 3.50 4.00 500 700 Determine the Laspeyres Price Index (LPI) and Paasche Price Index (PPI) for 2016 using 2000 as the base period.The following are data on the percent effectiveness of a pain reliever and the amounts of three different medi-cations (in milligrams) present in each capsule: PercentMedication A Medication B Medication C effectivex1 x2 x3 y15 20 10 4715 20 20 5415 30 10 5815 30 20 6630 20 10 5930 20 20 6730 30 10 7130 30 20 8345 20 10 7245 20 20 8245 30 10 8545 30 20 94Assuming that the regression is linear, estimate theregression coefficients after suitably coding each of thex’s, and express the estimated regression equation interms of the original variables.The management of BCD Inc. would like to separate the fixed and variable components of electricity as measured against machine hours in one of its plants. Data collected over the most recent six months follow:Electricity MachineMonth Cost Hours January $1,100 4,500February 1,110 4,700March 1,050 4,100April 1,200 5,000May 1,060 4,000June 1,120 4,600Required: 1. Using the method of least squares, compute the fixed cost and the variable cost rate for electricity expense. (Round estimates to the nearest cent.) 2. Compute coefficients of correlation and determination
- Could you please teel me why should a firm, for profit, care not only about the expected profit, but also about the variance of the profit.thanksABC Company has decided to use 20 test markets to examine the sensitivity of demand for its new product, Hand Sanitizer, to various prices, as shown in the following table. Each market had approximately the same level of business activity and population. Test Market Quantity sold (Thousands of Pens) Price Charged (cent) 1 20 50 2 21 50 3 19 55 4 18 60 5 20 60 6 14 65 7 16 65 8 20 70 9 12 70 10 14 80 11 12 70 12 10 70 13 14 65 14 16 90 15 18 45 16 16 70 17 20 65 18 12 80 19 18 70 20 10 50 Q.1. Using a linear regression model, estimate the demand function for ABC Company’s new product, Hand sanitizer. Q.2. Interpret the coefficient value of the independent variable of the estimated demand function. Q.3. What will be the predicted/estimated sale for each price shown in column 2? Q.4. Find the prediction interval at…Amex PLC has gathered following information on the sales of face mask from April 2020 toSeptember 2020.Month Sales ($)April 17,000May 18,000June 19,500July 22,000August 21,000September 23,000You are required to;b. Calculate the forecasted sales difference if you use 3-period weighted moving averagedesigned with the following weights: July 0.2, August 0.3 and September 0.5.
