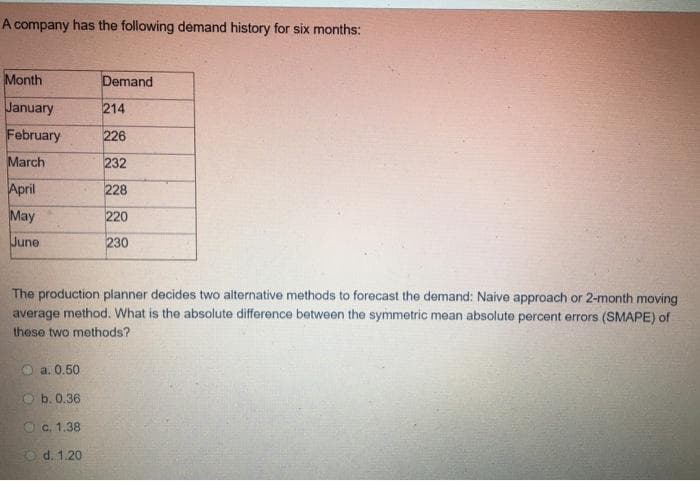
A company has the following demand history for six months: Month Demand January February 214 226 March 232 April 228 May 220 June 230 The production planner decides two alternative methods to forecast the demand: Naive approach or 2-month moving average method. What is the absolute difference between the symmetric mean absolute percent errors (SMAPE) of these two methods? O a. 0.50 O b. 0.36 Oc. 1.38 Od. 1.20


Q: ABC Company has decided to use 20 test markets to examine the sensitivity of demand for its new…
A: Since you have posted a question with multiple subparts, we will solve first three subparts for you.…
Q: Ajax has established a new sandwich shop format for airports and train stations.Here, the…
A:
Q: The researcher wishes to use graphical descriptive methods to present summaries of the data on each…
A: a) One of the conditions for selecting the number of classes is, 2number of classes ≥ sample…
Q: Predict the annual salary in dollars for a mathematics instructor with 10 years of experience.…
A:
Q: Milka makes boxes of chocolates for which the demand is uncertain. " Quarterly demand (in boxes of…
A: Given information: Quarter Year 1 Year 2 Year 3 Year 4 1 3000 3300 3502 3700 2 1700 2100…
Q: Consider the following data: Monthly Profit of a Gym: Month & Profit: Jan-12: 5700 Feb-12: 5453…
A: The Monthly Profit of the Gym is given as : Month Profit Jan-12 5700 Feb-12 5453…
Q: Given the following data for demand at the XYZ Company, calculate the monthly forecast for 2003…
A: Forecast are used to determine the future value over a period of time. Error in forecast can be…
Q: The LawnPlus Fertilizer Company distributes fertilizer tovarious lawn and garden shops. The company…
A: Since you have posted a question with multiple sub-parts, we will solve first 3 sub-parts for you.…
Q: 14. Given the following data for demand at the XYZ Company, calculate the monthly forecast using a…
A: The objective is to calculate the forecast error, absolute deviation, mean absolute deviation, bias…
Q: The following table gives the number of pints of type A blood used at Damascus Hospital in the past…
A: Given Data : Week of Pints Used Aug 31 345 Sept 7 372 Sept 14 412 Sept 21 383 Sept 28…
Q: Given the following demand for ten-period time frame as shown in the table below. Compute the…
A: For the given data Compute the three-period and five-period moving average forecasts. Plot the…
Q: Table: Data of House Value versus Rental Value Rental Value Rental Value Rental Value…
A: Given data, Value Rental 81000 6656 95000 7904 121000 12064 135000 8320 145000 8320…
Q: The number of observations (n) is 65 individuals. The researcher suggests using 7 class intervals to…
A: Given that, The researcher wishes to use graphical descriptive methods to present summaries of the…
Q: The accompanying data represent the annual rates of return of two companies' stock for the past 12…
A: Hello. Since your question has multiple sub-parts, we will solve first three sub-parts for you. If…
Q: Milka makes boxes of chocolates for which the demand is uncertain. " Quarterly demand (in boxes of…
A: Given information: Quarter Year 1 Year 2 Year 3 1 3000 3300 3502 2 1700 2100 2448 3 900…
Q: a) Agnes, a General Manager in XXX Company, estimated a multiplicative demand function of the form:…
A: Estimated demand equation is given by, Qd= aPapIaiP0a0 Then Qd= 0.022*P(-223)I1.354P00.133
Q: The three-period moving average for the third quarter of 2012 (rounded off to two decimals) is:…
A: The sales for first quarter in 2012 is 110, second quarter is 131, and third quarter is 133.
Q: 2. What features Bad Presentation Good Presentation of the 'Good Minimum Wage Minimum Wage 1.00…
A: Given: Two Bad and Good Presentation
Q: manufacturing firm, Caleb Corp, produces and sells product in its home (US) market, and in a foreign…
A: Given L= (.2, 150; .2, 200; .3, 220; .2,250; .1, 270) L= (1,195) (b) If the CEO is risk averse…
Q: Managers in the Stamping Department have been studying overhead cost and the relationship with…
A: * SOLUTION :- Given that ,
Q: In a study of claim payment times, you are given: (i) The data were not truncated or censored. (ii)…
A:
Q: Two different forecasting techniques (F1 and F2) were used to forecast demand for cases of bottled…
A: We will proceed into this way
Q: 13. Valley View Hospital (August data): Autopsies IP: Clinical Unit Adm. Disch Deaths НР No Cor…
A:
Q: Considering the aggregated demand for coffee beans for the following months shown below, what would…
A: Data is given for 6 months, We have to calculate forcast for 8 th month. We will use 3 months moving…
Q: The sales (in millions of dollars) for an 18-month period are as follows. Month Sales Month Sales 1…
A: Forecasting of time series data is done to predict the value for the future using the past trends.…
Q: Given the Actual Demand from January to June of 2021, along with the forecasts based on three (3)…
A: Given Information: Consider the given dataset: Month Actual Method 1 Method 2 Method 3 JAN…
Q: Table 1 HPF Demand in the last 12 periods Period Month Demand in '000 Period Month Demand in…
A: 1. Simple Moving Average with n = 4 Period Month Demand Simple moving average n = 4 Absolute…
Q: Frample 1 Represent the following data diagrammatically. Cost price: 3.00 8.00 5.00 3.00 2.00…
A:
Q: 1) A company had the following demand for the past 2 years, please develop an optimal forecasting…
A: The Naiive, twelve month moving average and simple linear regression (with demand as dependent…
Q: Past sales for months 1 to 5 of a large equipment are shown below. Month 1 2 3 4 5 Actual Demands 12…
A: From the given information we forecast for 6 using least squared equation
Q: Suppose that you are given the following sales data for the last three years, with Q1 being Quarter…
A: Given,
Q: The Manager of a towel company needs to accurately forecast the demand for towels. If the supply of…
A: image is attached with detailed solution.
Q: The problem is based on the following data given. Observations of the demand for a certain part…
A: The forecasts for July through December 2013 are: July: 206, August: -225, September: 242, October:…
Q: Bartman Industries' and Reynolds Inc.'s stock prices and dividends, along with the Winslow 5000…
A: Divide the amount gained or lost at the end of the year by the initial investment made at the…
Q: manufacturing firm, Caleb Corp, produces and sells product in its home (US) market, and in a foreign…
A: Given L= (.2, 150; .2, 200; .3, 220; .2,250; .1, 270)
Q: a. Fit a linear trend curve by the least-squares method to the following data and determine…
A: Given that - a) Year 2011 2012 2013 2014 2015 2016 2017 2018 2019 2020…
Q: The owner of Showtime Movie Theaters, Inc., would like to predict weekly gross revenue as a function…
A: Output:
Q: Given the following data on the number of pints of ice cream sold at a local ice cream store for a…
A: The moving average method is to be used to find the forecast for time period 11, using the…
Q: The Board of Governors of the Federal Reserve System publishes data on mortgage debt outstanding by…
A: Given data Year Debt 1 529 2 554 3 559 4 602 5 672 6 669 7 600 8 538 9 490…
Q: The table below shows the one-year sales data for a certain part. Month Demand Month Demand…
A: Given information: The data presents the sample for the months January through December.
Q: 5. Rather than keeping track of each demand observation, Betty Sucasas, a member of the marketing…
A:
Q: Suppose that you are given the following sales data for the last three years, with Q1 being Quarter…
A:
Q: Which of the following belongs to lagging indicators A. Manufacturers' new orders B. Stock prices,…
A: Lagging indicators are stats that observe an economic event. They generally used to confirm what has…
Q: The problem is based on the following data given. Observations of the demand for a certain part…
A: Given data Month Demand Jan 89 Feb 57 mar 144 April 221 may 177 June 280 July 223…
Q: Charlie Corporation's managers in the stamping department have been studying the overhead cost and…
A: Given information: Month Overhead Machine hours January 5,030 2,730 February 1,600 600…
Q: The table below represents the monthly unemployment rates in the US from January of 2005 through May…
A: Find the absolute change in the unemployment rate during 2008 as follows, The formula for the…
Q: A Juarez, Mexico, manufacturer of roofing supplies has developed monthly forecasts for a family of…
A:
Q: The following table reports the sale of umbrellas for 16 quarters. Year 1 Year 2 Year 3 Year 4…
A: In this case, the sale of umbrellas is the response variable, and the year and quarters are the…
Q: The following table shows the average yearly tuition and required fees, in thousand of dollars,…
A: Let the starting year be 2000. So, the table will be, x y 5 17.6 7 18.1 9 19.5 11 20.7…
Q: 89 july 223 Feb 57 august 286 mar 144 sept 212 april 221 oct 275 may 177 nov 188 june 280 dec 312 a)…
A: Month Demand Jan 89 Feb 57 mar 144 April 221 may 177 June 280 July 223 august 286…

Step by step
Solved in 2 steps with 4 images


- The management of BCD Inc. would like to separate the fixed and variable components of electricity as measured against machine hours in one of its plants. Data collected over the most recent six months follow:Electricity MachineMonth Cost Hours January $1,100 4,500February 1,110 4,700March 1,050 4,100April 1,200 5,000May 1,060 4,000June 1,120 4,600Required: 1. Using the method of least squares, compute the fixed cost and the variable cost rate for electricity expense. (Round estimates to the nearest cent.) 2. Compute coefficients of correlation and determinationToward the middle of the harvesting season, peaches for canning come in three types, early, late, and extra late, depending on the expected date of ripening. During a certain week, the data to the right were recorded at a fruit delivery station. Complete parts (a) through (d) below. 40 trucks went out carrying early peaches; 71 carried late peaches; 52 carried extra late peaches; 26 carried early and late; 32 carried late and extra late; 11 carried early and extra late; 6 carried all three; 5 carried only figs (no peaches at all). a) How many trucks carried only late variety peaches? trucks (Type a whole number.) (b) How many carried only extra late? trucks (Type a whole number.) (c) How many carried only one type of peach? trucks (Type a whole number.) (d)How many trucks (in all) went out during the week? trucks (Type a whole number.)Toward the middle of the harvesting season, peaches for canning come in three types, early, late, and extra late, depending on the expected date of ripening. During a certain week, the data to the right were recorded at a fruit delivery station. Complete parts (a) through (d) below. 40 trucks went out carrying early peaches; 76 carried late peaches; 64 carried extra late peaches; 31 carried early and late; 34 carried late and extra late; 13 carried early and extra late; 6 carried all three; 8 carried only figs (no peaches at all). a. How many trucks carried only late variety peaches? b. How many carried only extra late? c. How many carried only one type of peach? d. How many trucks (in all) went out during the week? Thank you so much
- If the data analyst hypothesizes that grocery sales are higher when payment is made using credit cards compared to cash payment, the null hypothesis would likely state that grocery sales are lower when payment is made using credit cards compared to cash payment. T/FIf a researcher wants to find out the average monthly expenses of all university students in Edmonton, this average would be an example of ________ . a. samplecross out b. statisticcross out c. populationcross out d. parameterFloyd Distributors, Inc., provides a variety of auto parts to small local garages. Floyd purchases parts from manufacturers according to the EOQ model and then ships the parts from a regional warehouse direct to its customers. For a particular type of muffler, Floyd's EOQ analysis recommends orders with Q* = 20 to satisfy an annual demand of 180 mufflers. Floyd's has 250 working days per year, and the lead time averages 15 days.Note: Use Appendix B to identify the areas for the standard normal distribution. What is the reorder point if Floyd assumes a constant demand rate? If required, round your answer up to the nearest whole number. r = fill in the blank 1 Suppose that an analysis of Floyd's muffler demand shows that the lead-time demand follows a normal probability distribution with µ = 12 and σ = 2.2. If Floyd's management can tolerate one stock-out per year, what is the revised reorder point? If required, round your answer up to the nearest whole number. r = fill in the blank…
- Could you please teel me why should a firm, for profit, care not only about the expected profit, but also about the variance of the profit.thanksABC Company has decided to use 20 test markets to examine the sensitivity of demand for its new product, Hand Sanitizer, to various prices, as shown in the following table. Each market had approximately the same level of business activity and population. Test Market Quantity sold (Thousands of Pens) Price Charged (cent) 1 20 50 2 21 50 3 19 55 4 18 60 5 20 60 6 14 65 7 16 65 8 20 70 9 12 70 10 14 80 11 12 70 12 10 70 13 14 65 14 16 90 15 18 45 16 16 70 17 20 65 18 12 80 19 18 70 20 10 50 Q.1. Using a linear regression model, estimate the demand function for ABC Company’s new product, Hand sanitizer. Q.2. Interpret the coefficient value of the independent variable of the estimated demand function. Q.3. What will be the predicted/estimated sale for each price shown in column 2? Q.4. Find the prediction interval at…The production planning period for flat-screen moni-tors at Louisiana’s Roa Electronics, Inc., is 4 months. Cost data are as follows:Regular-time cost per monitor $ 70Overtime cost per monitor $110Subcontract cost per monitor $120Carrying cost per monitor per month $ 4 For each of the next 4 months, capacity and demand for flat-screen monitors are as follows: PERIOD MONTH 1 MONTH 2 MONTH 3 a MONTH 4Demand 2,000 2,500 1,500 2,100CapacityRegular time 1,500 1,600 750 1,600Overtime 400 400 200 400Subcontract 600 600 600 600aFactory closes for 2 weeks of vacation.CEO Mohan Roa expects to enter the planning period with 500monitors in stock. Back ordering is not permitted (meaning, forexample, that monitors produced in the second month cannot beused to cover first month’s demand). Develop a production planthat minimizes costs using the transportation method.
- The product design group of Iyengar Electric Supplies,Inc., has determined that it needs to design a new series of switches.It must decide on one of three design strategies. The market forecastis for 200,000 units. The better and more sophisticated the designstrategy and the more time spent on value engineering, the less willbe the variable cost. The chief of engineering design, Dr. W. L.Berry, has decided that the following costs are a good estimate of theinitial and variable costs connected with each of the three strategies:a) Low-tech: A low-technology, low-cost process consisting ofhiring several new junior engineers. This option has a fixedcost of $45,000 and variable-cost probabilities of .3 for $.55each, .4 for $.50, and .3 for $.45.b) Subcontract: A medium-cost approach using a good outsidedesign staff. This approach would have a fixed cost of $65,000and variable-cost probabilities of .7 of $.45, .2 of $.40, and .1 of $.35.c) High-tech: A high-technology approach using the very…Suppose the true inverse demand relation for good X is Qdx = a + bPx + cM + e , and you estimated the parameters to be â = 22, b ˆ = −1.8, σâ = 2.5 , and σb ˆ = 0.7 . Find the approximate 95 percent confidence interval for the true values of a and b.In the packaging department of a large aircraft parts distributor, a fairly reliable estimate ofpackaging and processing costs can be determined by knowing the weight of an order. Thus, theweight is a cost driver that accounts for a sizable fraction of the packaging and processing costsat this company. Data for the past 10 orders are given as follows: