The followng table shows the actual demand observed over the last 11 years: Year 1 2 3 4 7 8 10 11 Demand 7 8 6 7 11 7 13 14 9 13 6 This exercise contains only parts b, c, and d. b) Using the 3-year moving average, provide the forecast from periods 4 through 12 (round your responses to one decimal place). Year 4 7 8. 9 10 11 12 Forecast 7 7 8 8.3 10.3 11.3 12 12 9.3 c) Using the 3-year weighted moving average with weights 0. 15, 0.35, and 0..50, using 0.50 for the most recent period, provide the forecast from periods 4 through 12 (round your responses to two decimal places). Year 4 7 10 11 12 Forecast
The followng table shows the actual demand observed over the last 11 years: Year 1 2 3 4 7 8 10 11 Demand 7 8 6 7 11 7 13 14 9 13 6 This exercise contains only parts b, c, and d. b) Using the 3-year moving average, provide the forecast from periods 4 through 12 (round your responses to one decimal place). Year 4 7 8. 9 10 11 12 Forecast 7 7 8 8.3 10.3 11.3 12 12 9.3 c) Using the 3-year weighted moving average with weights 0. 15, 0.35, and 0..50, using 0.50 for the most recent period, provide the forecast from periods 4 through 12 (round your responses to two decimal places). Year 4 7 10 11 12 Forecast

MATLAB: An Introduction with Applications
6th Edition
ISBN:9781119256830
Author:Amos Gilat
Publisher:Amos Gilat
Chapter1: Starting With Matlab
Section: Chapter Questions
Problem 1P

Related questions
Question
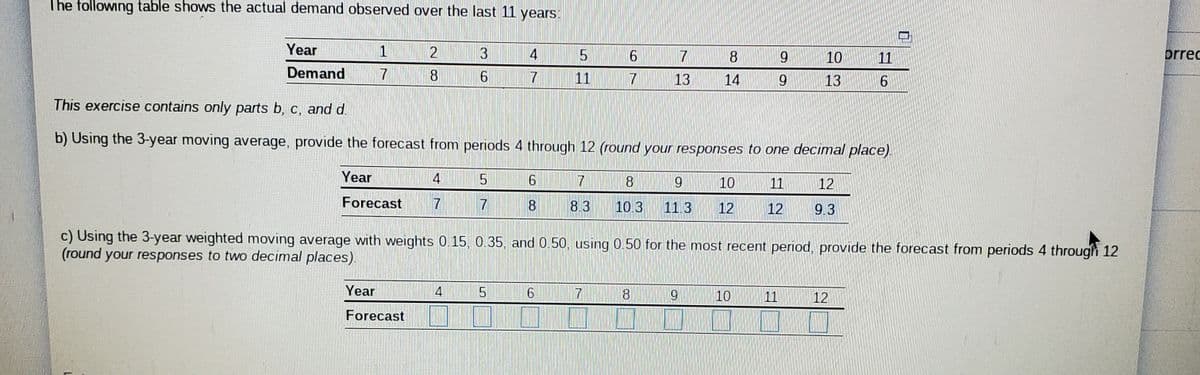
Transcribed Image Text:The following table shows the actual demand observed over the last 11 years:
orrec
Year
2
4
7
169
10
11
Demand
8.
11
13
14
6.
13
9.
This exercise contains only parts b, c, and d.
b) Using the 3-year moving average, provide the forecast from periods 4 through 12 (round your responses to one decimal place).
Year
4
6.
10
11
12
Forecast
8.3
10.3
11.3
12
12
9.3
c) Using the 3-year weighted moving average with weights 0.15, 0.35, and 0.50, using 0.50 for the most recent period, provide the forecast from periods 4 through 12
(round your responses to two decimal places).
Year
4
7
10
11
12
Forecast
Expert Solution
Step 1
Given:
The weights are 0.15, 0.35 and 0.50.
0.50 is for the most recent period.
The provided data is:
| Year | 1 | 2 | 3 | 4 | 5 | 6 | 7 | 8 | 9 | 10 | 11 |
| Demand | 7 | 8 | 6 | 7 | 11 | 7 | 13 | 14 | 9 | 13 | 6 |
b)
Steps to calculate 3 year moving average are as follows:
1) Calculate the average demand of previous 3 years to get the moving average of the current year.

Trending now
This is a popular solution!

Step by step
Solved in 5 steps

Knowledge Booster


Learn more about
Need a deep-dive on the concept behind this application? Look no further. Learn more about this topic, statistics and related others by exploring similar questions and additional content below.Recommended textbooks for you
MATLAB: An Introduction with Applications
Statistics
ISBN:
9781119256830
Author:
Amos Gilat
Publisher:
John Wiley & Sons Inc

Probability and Statistics for Engineering and th…
Statistics
ISBN:
9781305251809
Author:
Jay L. Devore
Publisher:
Cengage Learning

Statistics for The Behavioral Sciences (MindTap C…
Statistics
ISBN:
9781305504912
Author:
Frederick J Gravetter, Larry B. Wallnau
Publisher:
Cengage Learning
MATLAB: An Introduction with Applications
Statistics
ISBN:
9781119256830
Author:
Amos Gilat
Publisher:
John Wiley & Sons Inc
Probability and Statistics for Engineering and th…
Statistics
ISBN:
9781305251809
Author:
Jay L. Devore
Publisher:
Cengage Learning
Statistics for The Behavioral Sciences (MindTap C…
Statistics
ISBN:
9781305504912
Author:
Frederick J Gravetter, Larry B. Wallnau
Publisher:
Cengage Learning

Elementary Statistics: Picturing the World (7th E…
Statistics
ISBN:
9780134683416
Author:
Ron Larson, Betsy Farber
Publisher:
PEARSON

The Basic Practice of Statistics
Statistics
ISBN:
9781319042578
Author:
David S. Moore, William I. Notz, Michael A. Fligner
Publisher:
W. H. Freeman

Introduction to the Practice of Statistics
Statistics
ISBN:
9781319013387
Author:
David S. Moore, George P. McCabe, Bruce A. Craig
Publisher:
W. H. Freeman