Two different simple random samples are drawn from two different populations. The first sample consists of 40 people with 18 having a common attribute. The second sample consists of 2000 people with 1456 of them having the same common attribute. Compare the results from a hypothesis test of p, = P2 (with a 0.05 significance level) and a 95% confidence interval estimate of p, -P2- What are the null and altemative hypotheses for the hypothesis test? OA Ho: P, *P2 H: P =P2 O B. Hg: P, 2P2 H4: P *P2 OC. Ho: P1 =P2 H: P1 P2 Identify the test statistic.
Two different simple random samples are drawn from two different populations. The first sample consists of 40 people with 18 having a common attribute. The second sample consists of 2000 people with 1456 of them having the same common attribute. Compare the results from a hypothesis test of p, = P2 (with a 0.05 significance level) and a 95% confidence interval estimate of p, -P2- What are the null and altemative hypotheses for the hypothesis test? OA Ho: P, *P2 H: P =P2 O B. Hg: P, 2P2 H4: P *P2 OC. Ho: P1 =P2 H: P1 P2 Identify the test statistic.

College Algebra (MindTap Course List)
12th Edition
ISBN:9781305652231
Author:R. David Gustafson, Jeff Hughes
Publisher:R. David Gustafson, Jeff Hughes
Chapter8: Sequences, Series, And Probability
Section8.7: Probability
Problem 58E: What is meant by the sample space of an experiment?

Related questions

Question
Could you please help find p value, conclusion, and the confidence interval claim. Thank you!
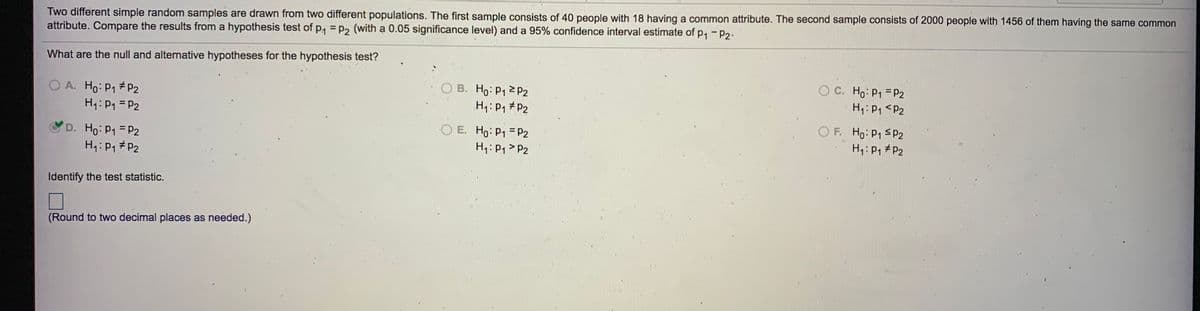
Transcribed Image Text:Two different simple random samples are drawn from two different populations. The first sample consists of 40 people with 18 having a common attribute. The second sample consists of 2000 people with 1456 of them having the same common
attribute. Compare the results from a hypothesis test of p, = P2 (with a 0.05 significance level) and a 95% confidence interval estimate of p, - P2-
%3D
What are the null and alternative hypotheses for the hypothesis test?
O A. Ho: P1 P2
H1:P1 = P2
O B. Ho: P1 2 P2
H:P, #P2
O C. Ho: P1 = P2
H1: P, <P2
D. Ho: P1 P2
H1: P, #P2
O E. Ho: P1 = P2
H1: P1 > P2
OF. Ho: P1 SP2
H1: P1 #P2
Identify the test statistic.
(Round to two decimal places as needed.)
Expert Solution
This question has been solved!
Explore an expertly crafted, step-by-step solution for a thorough understanding of key concepts.

This is a popular solution!

Trending now
This is a popular solution!

Step by step
Solved in 2 steps

Knowledge Booster


Learn more about
Need a deep-dive on the concept behind this application? Look no further. Learn more about this topic, statistics and related others by exploring similar questions and additional content below.Recommended textbooks for you
College Algebra (MindTap Course List)
Algebra
ISBN:
9781305652231
Author:
R. David Gustafson, Jeff Hughes
Publisher:
Cengage Learning
College Algebra (MindTap Course List)
Algebra
ISBN:
9781305652231
Author:
R. David Gustafson, Jeff Hughes
Publisher:
Cengage Learning