Two teaching methods and their effects on science test scores are being reviewed. A random sample of 6 students, taught in traditional lab sessions, had a mean test score of 78.8 with a standard deviation of 4.6. A random sample of 12 students, taught using interactive simulation software, had a mean test score of 87.8 with a standard deviation of 5.9. Do these results support the claim that the mean science test score is lower for students taught in traditional lab sessions than it is for students taught using interactive simulation software? Let uj be the mean test score for the students taught in traditional lab sessions and uz be the mean test score for students taught using interactive simulation software. Use a significance level of a = 0.05 for the test. Assume that the population variances are equal and that the two populations are normally distributed. Step 3 of 4: Determine the decision rule for rejecting the null hypothesis Ho. Round your answer to three decimal places. Answer 囲 Tables в Кеурad Keyboard Shortcuts Previous Step Answers Reject Ho if
Two teaching methods and their effects on science test scores are being reviewed. A random sample of 6 students, taught in traditional lab sessions, had a mean test score of 78.8 with a standard deviation of 4.6. A random sample of 12 students, taught using interactive simulation software, had a mean test score of 87.8 with a standard deviation of 5.9. Do these results support the claim that the mean science test score is lower for students taught in traditional lab sessions than it is for students taught using interactive simulation software? Let uj be the mean test score for the students taught in traditional lab sessions and uz be the mean test score for students taught using interactive simulation software. Use a significance level of a = 0.05 for the test. Assume that the population variances are equal and that the two populations are normally distributed. Step 3 of 4: Determine the decision rule for rejecting the null hypothesis Ho. Round your answer to three decimal places. Answer 囲 Tables в Кеурad Keyboard Shortcuts Previous Step Answers Reject Ho if

MATLAB: An Introduction with Applications
6th Edition
ISBN:9781119256830
Author:Amos Gilat
Publisher:Amos Gilat
Chapter1: Starting With Matlab
Section: Chapter Questions
Problem 1P

Related questions
Topic Video
Question
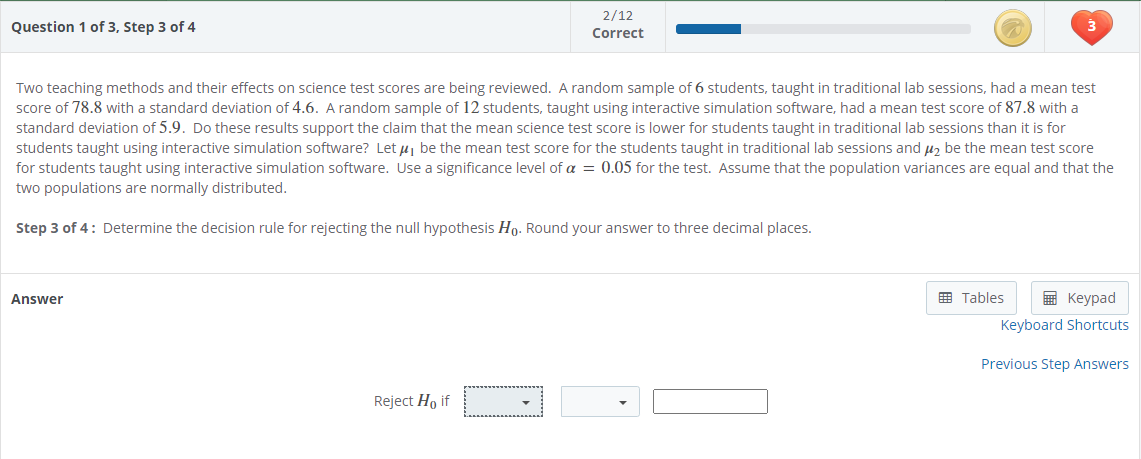
Transcribed Image Text:2/12
Question 1 of 3, Step 3 of 4
Correct
Two teaching methods and their effects on science test scores are being reviewed. A random sample of 6 students, taught in traditional lab sessions, had a mean test
score of 78.8 with a standard deviation of 4.6. A random sample of 12 students, taught using interactive simulation software, had a mean test score of 87.8 with a
standard deviation of 5.9. Do these results support the claim that the mean science test score is lower for students taught in traditional lab sessions than it is for
students taught using interactive simulation software? Let uj be the mean test score for the students taught in traditional lab sessions and u2 be the mean test score
for students taught using interactive simulation software. Use a significance level of a = 0.05 for the test. Assume that the population variances are equal and that the
two populations are normally distributed.
Step 3 of 4: Determine the decision rule for rejecting the null hypothesis Ho. Round your answer to three decimal places.
Answer
E Tables
E Keypad
Keyboard Shortcuts
Previous Step Answers
Reject Ho if
Expert Solution
This question has been solved!
Explore an expertly crafted, step-by-step solution for a thorough understanding of key concepts.

This is a popular solution!

Trending now
This is a popular solution!

Step by step
Solved in 2 steps

Knowledge Booster


Learn more about
Need a deep-dive on the concept behind this application? Look no further. Learn more about this topic, statistics and related others by exploring similar questions and additional content below.Recommended textbooks for you
MATLAB: An Introduction with Applications
Statistics
ISBN:
9781119256830
Author:
Amos Gilat
Publisher:
John Wiley & Sons Inc

Probability and Statistics for Engineering and th…
Statistics
ISBN:
9781305251809
Author:
Jay L. Devore
Publisher:
Cengage Learning

Statistics for The Behavioral Sciences (MindTap C…
Statistics
ISBN:
9781305504912
Author:
Frederick J Gravetter, Larry B. Wallnau
Publisher:
Cengage Learning
MATLAB: An Introduction with Applications
Statistics
ISBN:
9781119256830
Author:
Amos Gilat
Publisher:
John Wiley & Sons Inc
Probability and Statistics for Engineering and th…
Statistics
ISBN:
9781305251809
Author:
Jay L. Devore
Publisher:
Cengage Learning
Statistics for The Behavioral Sciences (MindTap C…
Statistics
ISBN:
9781305504912
Author:
Frederick J Gravetter, Larry B. Wallnau
Publisher:
Cengage Learning

Elementary Statistics: Picturing the World (7th E…
Statistics
ISBN:
9780134683416
Author:
Ron Larson, Betsy Farber
Publisher:
PEARSON

The Basic Practice of Statistics
Statistics
ISBN:
9781319042578
Author:
David S. Moore, William I. Notz, Michael A. Fligner
Publisher:
W. H. Freeman

Introduction to the Practice of Statistics
Statistics
ISBN:
9781319013387
Author:
David S. Moore, George P. McCabe, Bruce A. Craig
Publisher:
W. H. Freeman